Display Title
Math Clip Art--Applications of Linear Functions: Cricket Chirps 04
Display Title
Math Clip Art--Applications of Linear Functions: Cricket Chirps 04

Topic
Linear Functions
Description
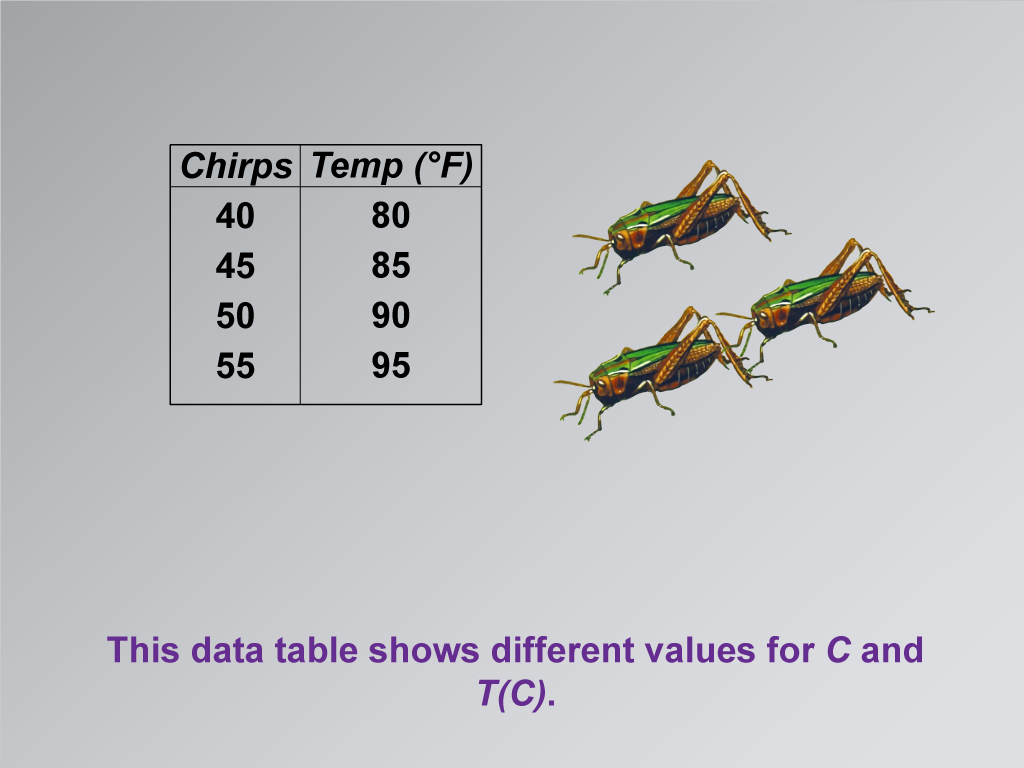
This image presents a data table showing different values for cricket chirps (C) and corresponding temperatures (T). It's a crucial step in building a linear function model, as it provides the raw data from which the relationship will be derived.
Using math clip art to display data in this tabular format is highly beneficial for students. It helps them see the connection between raw data and the mathematical models they're learning to create. This visual representation makes the abstract concept of data collection and analysis more concrete and relatable, bridging the gap between theory and practical application.
Teacher's script: "Let's examine this data table carefully. It shows us actual measurements of cricket chirps and their corresponding temperatures. What patterns do you notice as you look at these numbers? How might we use this information to predict temperature based on cricket chirps? This data forms the foundation for our linear function model, so understanding it is key to our next steps."
For a complete collection of math clip art related to Applications of Linear Functions click on this link: Applications of Linear Functions: Cricket Chirps Collection.
| Common Core Standards | CCSS.MATH.CONTENT.8.F.A.2, CCSS.MATH.CONTENT.8.F.A.3, CCSS.MATH.CONTENT.HSF.LE.A.1.A |
|---|---|
| Grade Range | 8 - 10 |
| Curriculum Nodes |
Algebra • Linear Functions and Equations • Graphs of Linear Functions • Slope-Intercept Form |
| Copyright Year | 2021 |
| Keywords | linear functions |