Display Title
Math Clip Art--Applications of Linear Functions: Cricket Chirps 05
Display Title
Math Clip Art--Applications of Linear Functions: Cricket Chirps 05

Topic
Linear Functions
Description
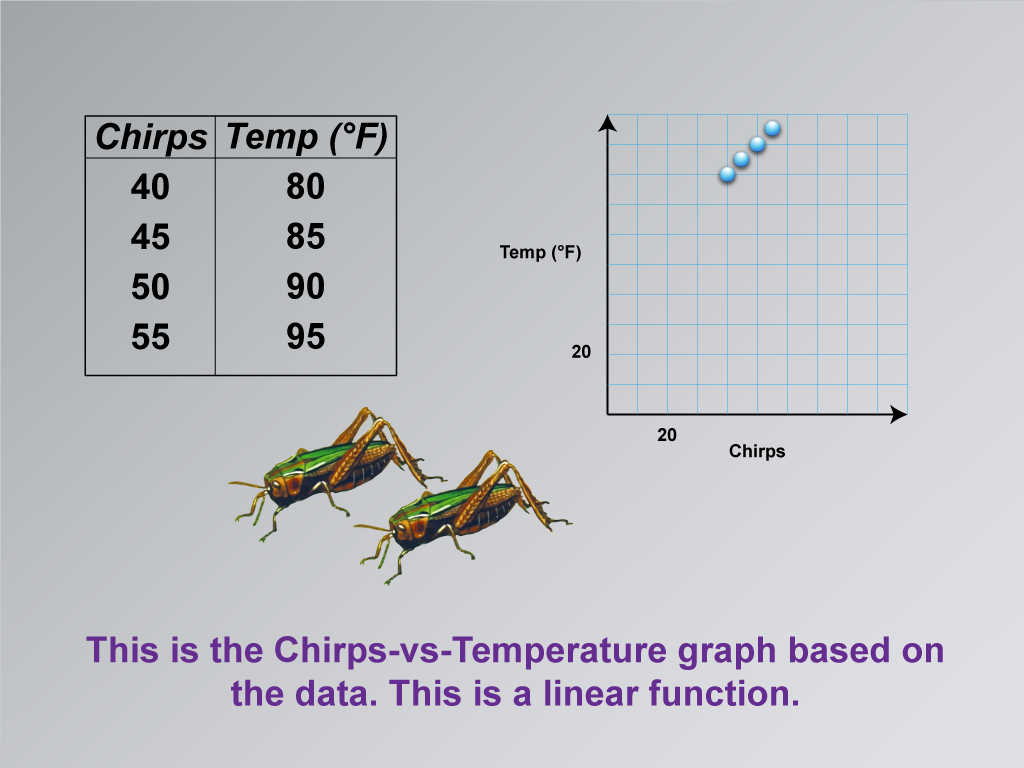
This image in the series on applications of linear functions presents a graph of the chirps-vs-temperature data. It shows discrete points plotted on a coordinate plane, demonstrating the linear relationship between cricket chirps and temperature.
The use of math clip art to visualize data points on a graph is an essential step in teaching linear functions. It helps students transition from raw data to a visual representation, allowing them to see patterns and relationships more easily. This approach bridges the gap between concrete data and abstract mathematical concepts, making the learning process more intuitive and engaging.
Teacher's script: "Take a look at this graph. Each point represents a pair of values from our data table - the number of chirps and the corresponding temperature. What do you notice about the arrangement of these points? They seem to follow a pattern, don't they? This visual representation gives us our first clue that we're dealing with a linear function. How might we use this graph to make predictions about temperature based on cricket chirps?"
For a complete collection of math clip art related to Applications of Linear Functions click on this link: Applications of Linear Functions: Cricket Chirps Collection.
| Common Core Standards | CCSS.MATH.CONTENT.8.F.A.2, CCSS.MATH.CONTENT.8.F.A.3, CCSS.MATH.CONTENT.HSF.LE.A.1.A |
|---|---|
| Grade Range | 8 - 10 |
| Curriculum Nodes |
Algebra • Linear Functions and Equations • Graphs of Linear Functions • Slope-Intercept Form |
| Copyright Year | 2021 |
| Keywords | linear functions |