Display Title
Math Clip Art--Applications of Linear Functions: Cricket Chirps 06
Display Title
Math Clip Art--Applications of Linear Functions: Cricket Chirps 06

Topic
Linear Functions
Description
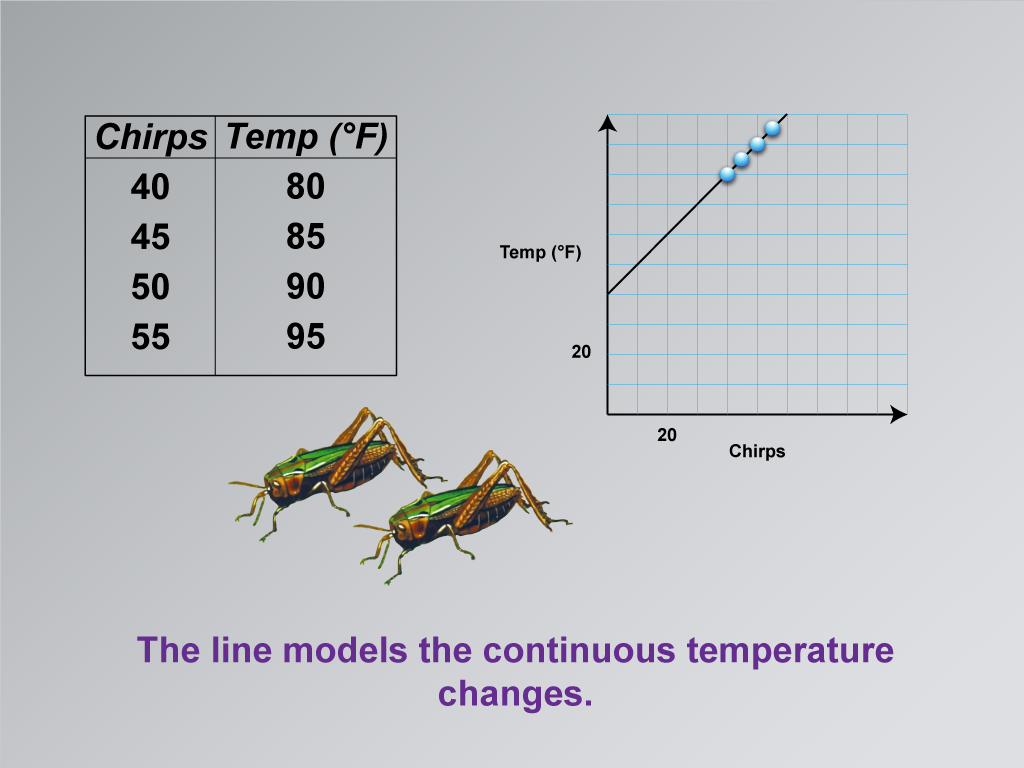
This image builds upon the previous one in the series on applications of linear functions. It shows the same data points as before, but now connected by a straight line. This line represents the continuous relationship between cricket chirps and temperature.
Using math clip art to illustrate the transition from discrete data points to a continuous linear model is crucial in teaching linear functions. It helps students understand how we can use a line to represent and predict values between and beyond our known data points. This visual representation makes the concepts of interpolation and extrapolation more tangible and easier to grasp.
Teacher's script: "Now we've connected our data points with a straight line. This line helps us model the continuous changes in temperature as the number of cricket chirps changes. What does this tell us about the relationship between cricket chirps and temperature? How might we use this line to predict temperatures for numbers of chirps we haven't measured? Think about how this line allows us to make estimates between and beyond our actual data points."
For a complete collection of math clip art related to Applications of Linear Functions click on this link: Applications of Linear Functions: Cricket Chirps Collection.
| Common Core Standards | CCSS.MATH.CONTENT.8.F.A.2, CCSS.MATH.CONTENT.8.F.A.3, CCSS.MATH.CONTENT.HSF.LE.A.1.A |
|---|---|
| Grade Range | 8 - 10 |
| Curriculum Nodes |
Algebra • Linear Functions and Equations • Graphs of Linear Functions • Slope-Intercept Form |
| Copyright Year | 2021 |
| Keywords | linear functions |