Display Title
Math Clip Art--Applications of Linear Functions: Cricket Chirps 07
Display Title
Math Clip Art--Applications of Linear Functions: Cricket Chirps 07

Topic
Linear Functions
Description
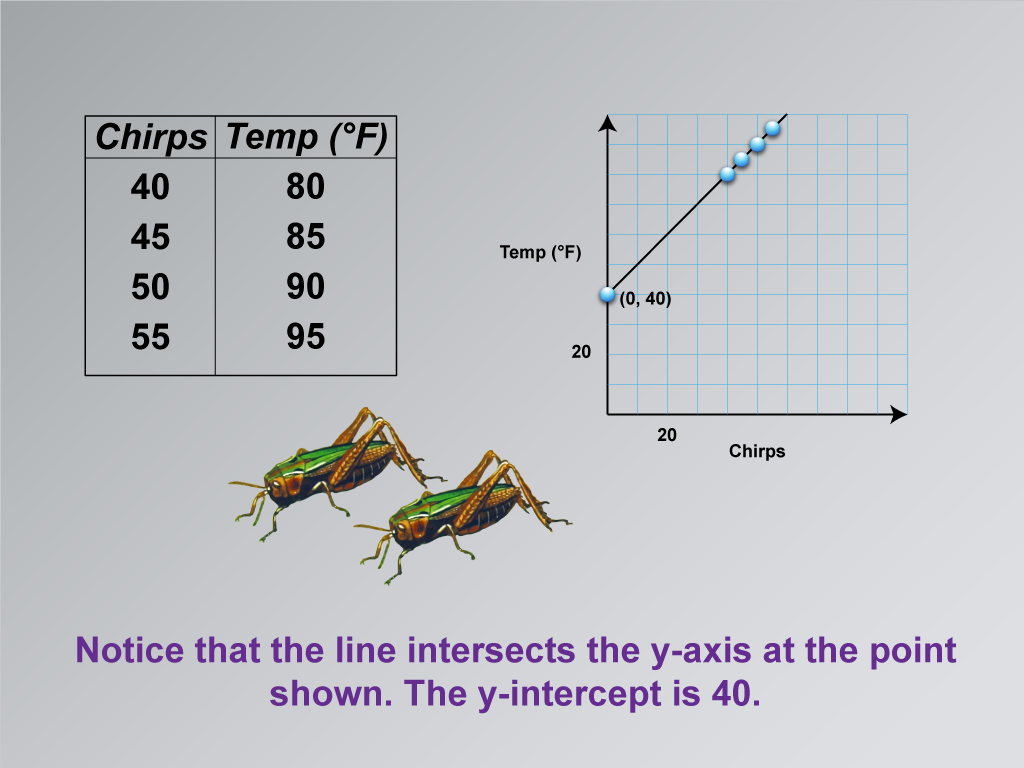
This image in the series on applications of linear functions highlights a crucial feature of the graph: the y-intercept. It shows where the line intersects the y-axis, indicating the y-intercept value.
Using math clip art to visually emphasize the y-intercept is an effective way to teach this important concept in linear functions. It helps students understand what the y-intercept represents in the context of the real-world scenario (in this case, the theoretical temperature when there are zero cricket chirps). This visual approach makes abstract concepts more concrete and memorable.
Teacher's script: "Let's focus on where our line crosses the y-axis. This point is called the y-intercept. What might this mean in terms of our cricket chirps and temperature model? It suggests a theoretical temperature when we hear no cricket chirps. Is this realistic? Why or why not? Understanding the y-intercept helps us interpret our linear model in real-world terms and can lead to interesting discussions about the limitations of mathematical models."
For a complete collection of math clip art related to Applications of Linear Functions click on this link: Applications of Linear Functions: Cricket Chirps Collection.
| Common Core Standards | CCSS.MATH.CONTENT.8.F.A.2, CCSS.MATH.CONTENT.8.F.A.3, CCSS.MATH.CONTENT.HSF.LE.A.1.A |
|---|---|
| Grade Range | 8 - 10 |
| Curriculum Nodes |
Algebra • Linear Functions and Equations • Graphs of Linear Functions • Slope-Intercept Form |
| Copyright Year | 2021 |
| Keywords | linear functions |