Display Title
Math Clip Art--Applications of Linear Functions: Cricket Chirps 08
Display Title
Math Clip Art--Applications of Linear Functions: Cricket Chirps 08

Topic
Linear Functions
Description
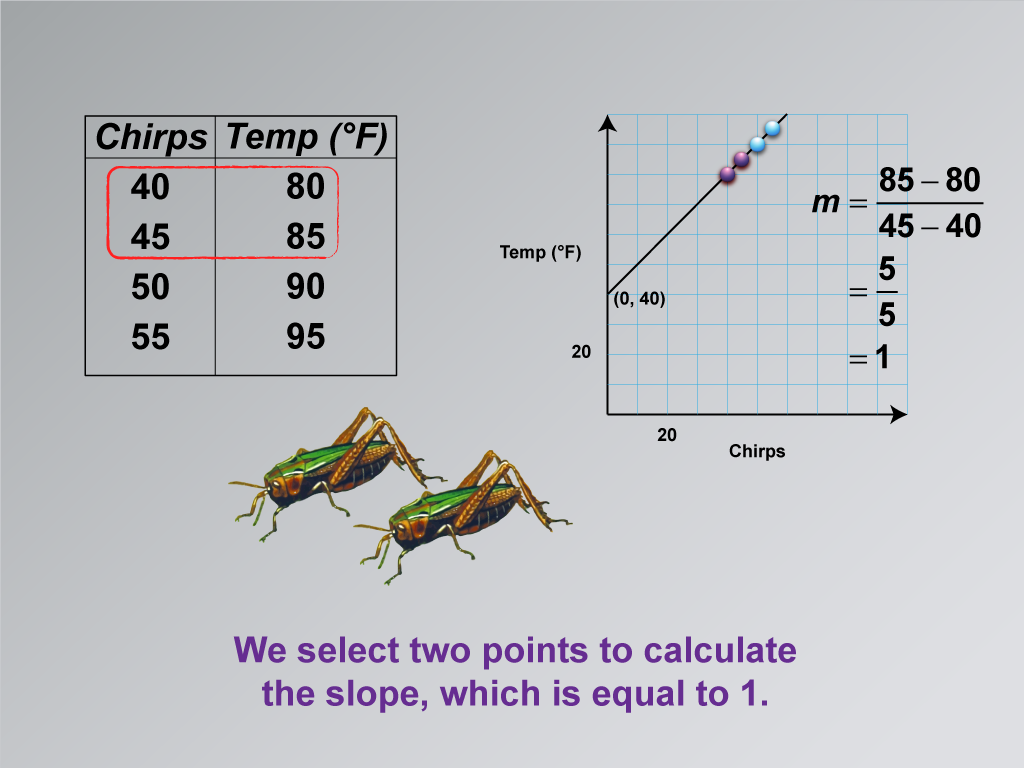
This image in the series on applications of linear functions focuses on calculating the slope of the line. It highlights two specific points on the graph and shows the slope formula used to determine the slope value.
Using math clip art to illustrate the process of calculating slope is invaluable in teaching linear functions. It provides a visual representation of the abstract concept of rate of change, helping students understand how the slope relates to the real-world relationship between variables. This approach makes the mathematics more accessible and connects it directly to the practical application.
Teacher's script: "Now we're going to calculate the slope of our line. We'll use these two points on our graph. The slope tells us how much the temperature changes for each additional cricket chirp. Let's work through this calculation together. What does the slope mean in the context of our cricket chirp model? How can we interpret this value in terms of the relationship between temperature and cricket chirps?"
For a complete collection of math clip art related to Applications of Linear Functions click on this link: Applications of Linear Functions: Cricket Chirps Collection.
| Common Core Standards | CCSS.MATH.CONTENT.8.F.A.2, CCSS.MATH.CONTENT.8.F.A.3, CCSS.MATH.CONTENT.HSF.LE.A.1.A |
|---|---|
| Grade Range | 8 - 10 |
| Curriculum Nodes |
Algebra • Linear Functions and Equations • Graphs of Linear Functions • Slope-Intercept Form |
| Copyright Year | 2021 |
| Keywords | linear functions |