Display Title
Math Clip Art--Applications of Linear Functions: Cricket Chirps 09
Display Title
Math Clip Art--Applications of Linear Functions: Cricket Chirps 09

Topic
Linear Functions
Description
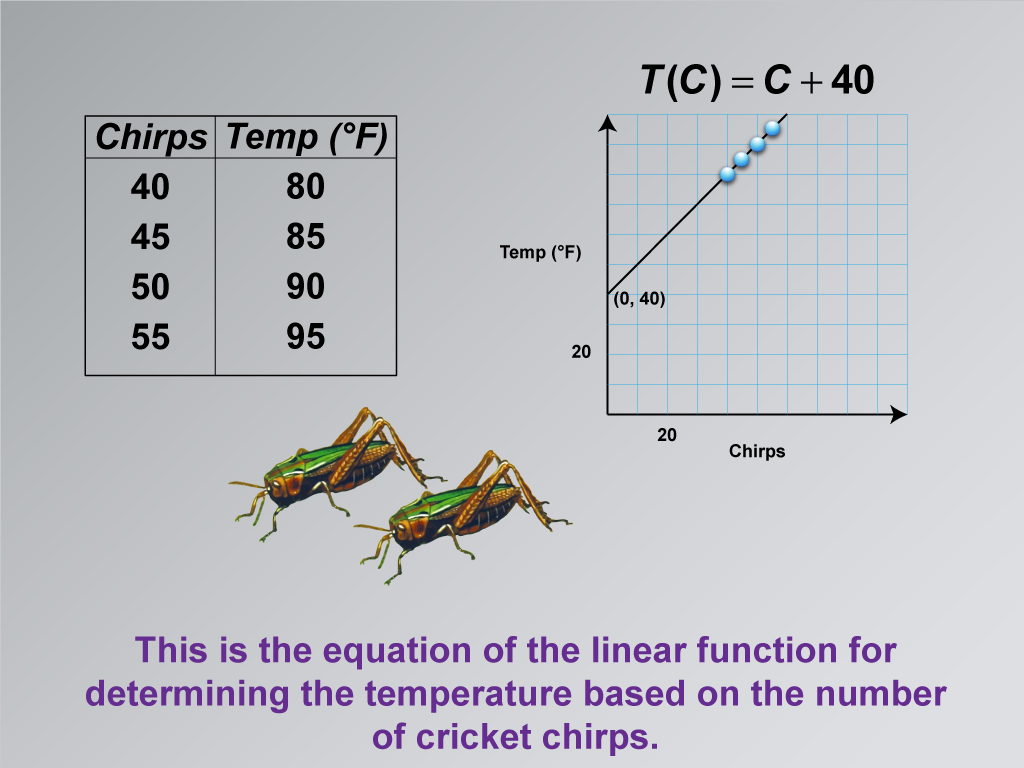
This image in the series on applications of linear functions presents the equation of the linear function. This equation represents the relationship between temperature (T) and the number of cricket chirps (C).
Using math clip art to display the final equation is a crucial step in teaching linear functions. It helps students see how the graph, the slope, and the y-intercept all come together to form a mathematical model. This visual representation bridges the gap between the concrete problem and its abstract mathematical solution, making the concept more accessible and meaningful to students.
Teacher's script: "Here's the equation that describes our linear function. It tells us how to determine the temperature based on the number of cricket chirps. Let's break it down: T represents temperature, C represents the number of chirps. How does this equation relate to what we've learned about slope and y-intercept? How could we use this to predict the temperature if we counted a specific number of cricket chirps in a minute? This equation is a powerful tool that encapsulates everything we've learned about this relationship."
For a complete collection of math clip art related to Applications of Linear Functions click on this link: Applications of Linear Functions: Cricket Chirps Collection.
| Common Core Standards | CCSS.MATH.CONTENT.8.F.A.2, CCSS.MATH.CONTENT.8.F.A.3, CCSS.MATH.CONTENT.HSF.LE.A.1.A |
|---|---|
| Grade Range | 8 - 10 |
| Curriculum Nodes |
Algebra • Linear Functions and Equations • Graphs of Linear Functions • Slope-Intercept Form |
| Copyright Year | 2021 |
| Keywords | linear functions |