Display Title
Math Clip Art--Applications of Linear Functions: Distance vs. Time 04
Display Title
Math Clip Art--Applications of Linear Functions: Distance vs. Time 04

Topic
Linear Functions
Description
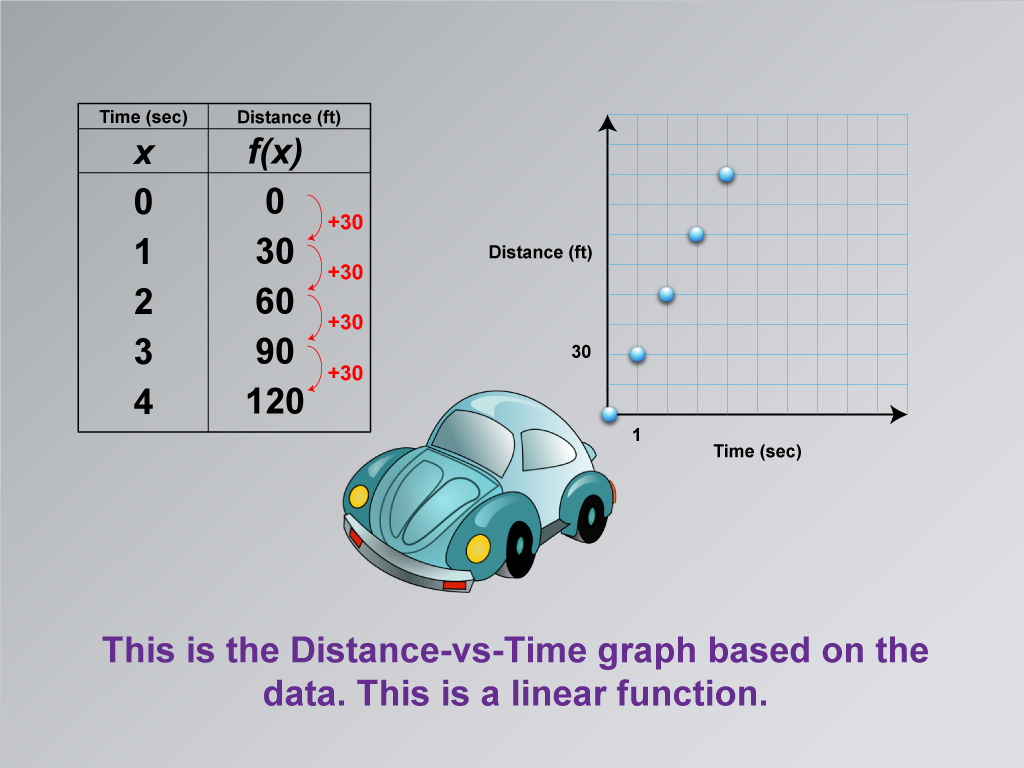
This math clip art image is part of a series demonstrating applications of linear functions, specifically in modeling the relationship between distance and time. The image introduces a graph that visually represents the data from the previous illustrations. It shows a distance-vs-time graph based on the car's movement, clearly depicting a linear function.
By transitioning from a data table to a graphical representation, this image helps students visualize the linear relationship between distance and time. The graph likely shows a straight line, reinforcing the concept of constant rate of change. This visual aid is invaluable in helping students understand how tabular data translates into a graphical format, a crucial skill in interpreting and analyzing linear functions.
Teacher's Script: "Let's take our data to the next level. This graph shows the same information we've been looking at, but in a picture form. See how the points form a straight line? This is what a linear function looks like on a graph. The straight line tells us that our car is moving at a steady speed. Can you see how each second that passes (that's our x-axis) corresponds to a certain distance traveled (our y-axis)? This graph is a powerful tool that lets us see patterns and make predictions about the car's journey at a glance."
For a complete collection of math clip art related to Applications of Linear Functions click on this link: Applications of Linear Functions: Distance vs. Time Collection.
| Common Core Standards | CCSS.MATH.CONTENT.8.F.A.2, CCSS.MATH.CONTENT.8.F.A.3, CCSS.MATH.CONTENT.HSF.LE.A.1.A |
|---|---|
| Grade Range | 8 - 10 |
| Curriculum Nodes |
Algebra • Linear Functions and Equations • Graphs of Linear Functions • Slope-Intercept Form |
| Copyright Year | 2021 |
| Keywords | linear functions |