Display Title
Math Clip Art--Applications of Linear Functions: Hooke's Law 05
Display Title
Math Clip Art--Applications of Linear Functions: Hooke's Law 05

Topic
Linear Functions
Description
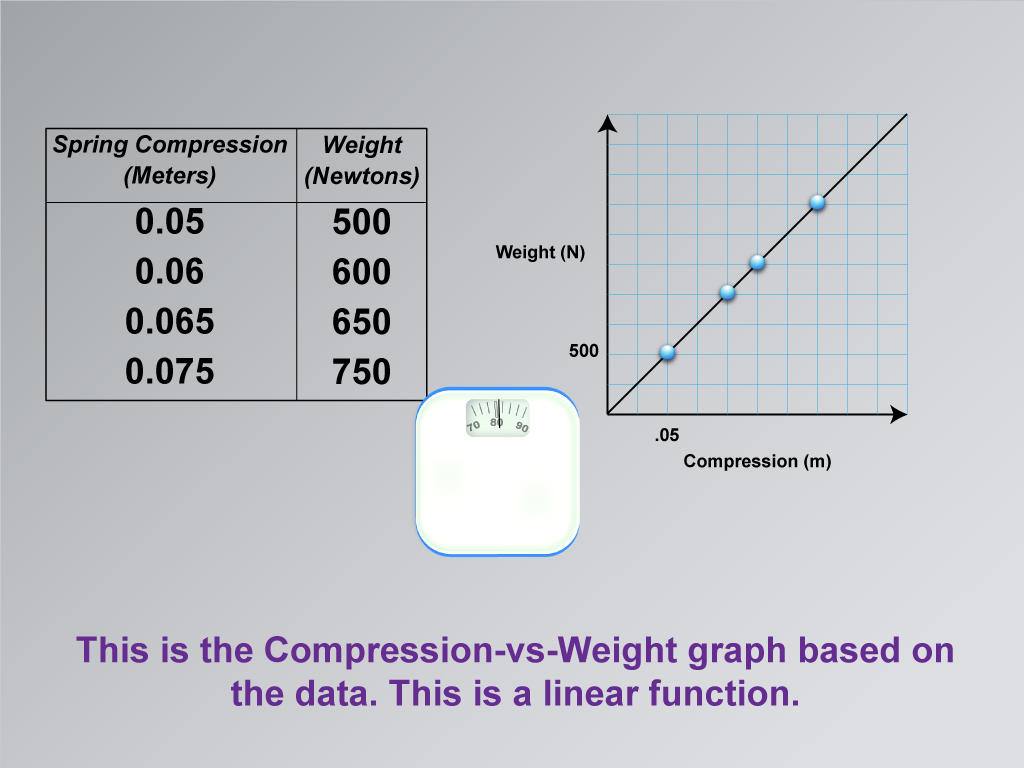
This image is a continuation of the series on applications of linear functions, specifically illustrating Hooke's Law. It builds upon the previous image by presenting a graph of the data collected from the weight scale experiment.
The illustration shows a Compression-vs-Weight graph based on the data from the weight scale. The graph displays a clear linear relationship, with data points connected by a straight line. This visual representation helps students see how the abstract concept of a linear function manifests in real-world data.
Incorporating such math clip art into lessons is crucial for effectively teaching mathematical concepts. It provides a concrete visualization of how data can be represented graphically and how linear relationships appear in graphical form. These images can be seamlessly integrated into lessons on linear functions, helping students understand how to interpret and create graphs of linear relationships.
A teacher might explain this image by saying: "Now that we've collected our data, let's see what it looks like on a graph. Each point on this graph represents a person's weight and how much the spring in the scale compressed. Notice how these points form a straight line? This is what a linear function looks like when we graph it. The straight line tells us that as weight increases, the spring compression increases at a constant rate. This is exactly what Hooke's Law predicts!"
For a complete collection of math clip art related to Applications of Linear Functions click on this link: Applications of Linear Functions: Hooke's Law Collection.
| Common Core Standards | CCSS.MATH.CONTENT.8.F.A.2, CCSS.MATH.CONTENT.8.F.A.3, CCSS.MATH.CONTENT.HSF.LE.A.1.A |
|---|---|
| Grade Range | 8 - 10 |
| Curriculum Nodes |
Algebra • Linear Functions and Equations • Graphs of Linear Functions • Slope-Intercept Form • Ratios, Proportions, and Percents • Proportions |
| Copyright Year | 2021 |
| Keywords | linear functions |