Display Title
Math Clip Art--Applications of Linear Functions: Hooke's Law 07
Display Title
Math Clip Art--Applications of Linear Functions: Hooke's Law 07

Topic
Linear Functions
Description
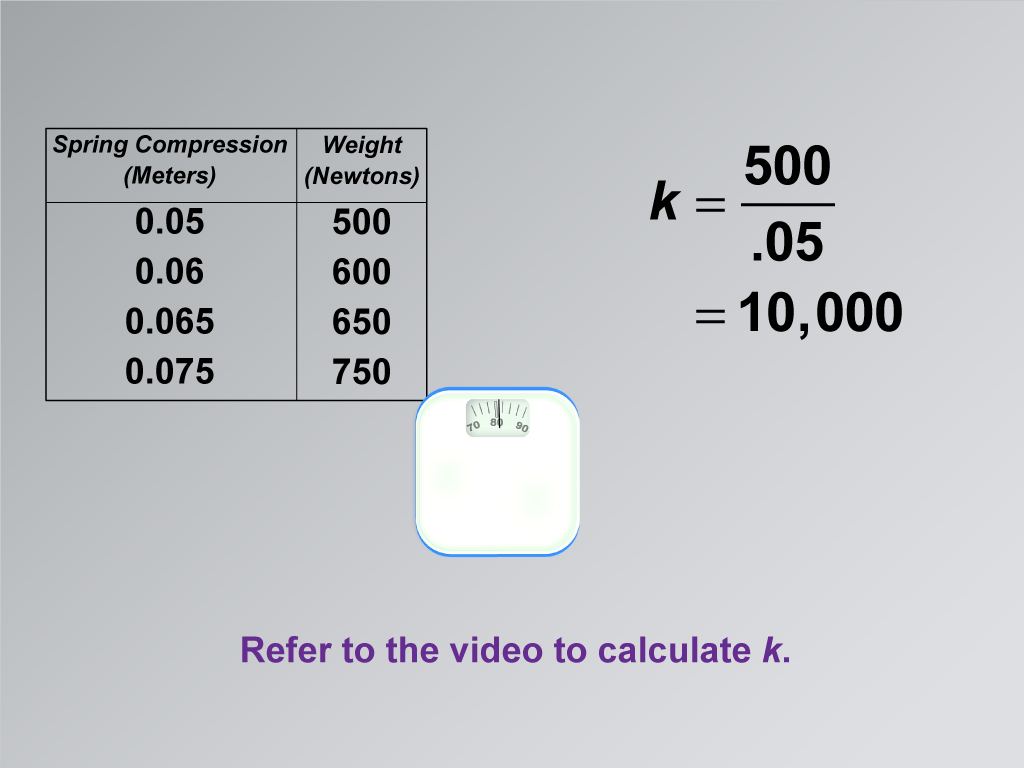
This image is part of a series illustrating applications of linear functions, focusing on Hooke's Law. It builds upon previous images by demonstrating how to calculate the spring constant 'k' using the data collected from the weight scale experiment.
Note: Here is the link to the video referenced: https://www.media4math.com/library/42143/asset-preview
The illustration shows the data table, weight scale, and the equation for calculating the value of k. This visual representation helps students understand how to use real-world data to determine the parameters of a linear function. It bridges the gap between theoretical knowledge and practical application, showing how mathematical models can be derived from experimental data.
Incorporating such math clip art into lessons is crucial for effectively teaching mathematical concepts. It provides a step-by-step visual guide on how to apply mathematical principles to solve real-world problems. These images can be seamlessly integrated into lessons on linear functions, helping students understand how to analyze data and derive mathematical relationships.
A teacher might explain this image by saying: "Now that we have our data and understand the equation, let's figure out the spring constant 'k' for our scale. This value tells us how stiff the spring is. We can calculate it using the data we collected. By doing this, we're not just using a formula someone gave us - we're actually deriving it from real measurements! This process of using data to build a mathematical model is a crucial skill in many fields of science and engineering."
For a complete collection of math clip art related to Applications of Linear Functions click on this link: Applications of Linear Functions: Hooke's Law Collection.
| Common Core Standards | CCSS.MATH.CONTENT.8.F.A.2, CCSS.MATH.CONTENT.8.F.A.3, CCSS.MATH.CONTENT.HSF.LE.A.1.A |
|---|---|
| Grade Range | 8 - 10 |
| Curriculum Nodes |
Algebra • Linear Functions and Equations • Graphs of Linear Functions • Slope-Intercept Form • Ratios, Proportions, and Percents • Proportions |
| Copyright Year | 2021 |
| Keywords | linear functions, constant of proportionality |