Display Title
Math Clip Art--Applications of Linear Functions: Temperature Conversion 04
Display Title
Math Clip Art--Applications of Linear Functions: Temperature Conversion 04

Topic
Linear Functions
Description
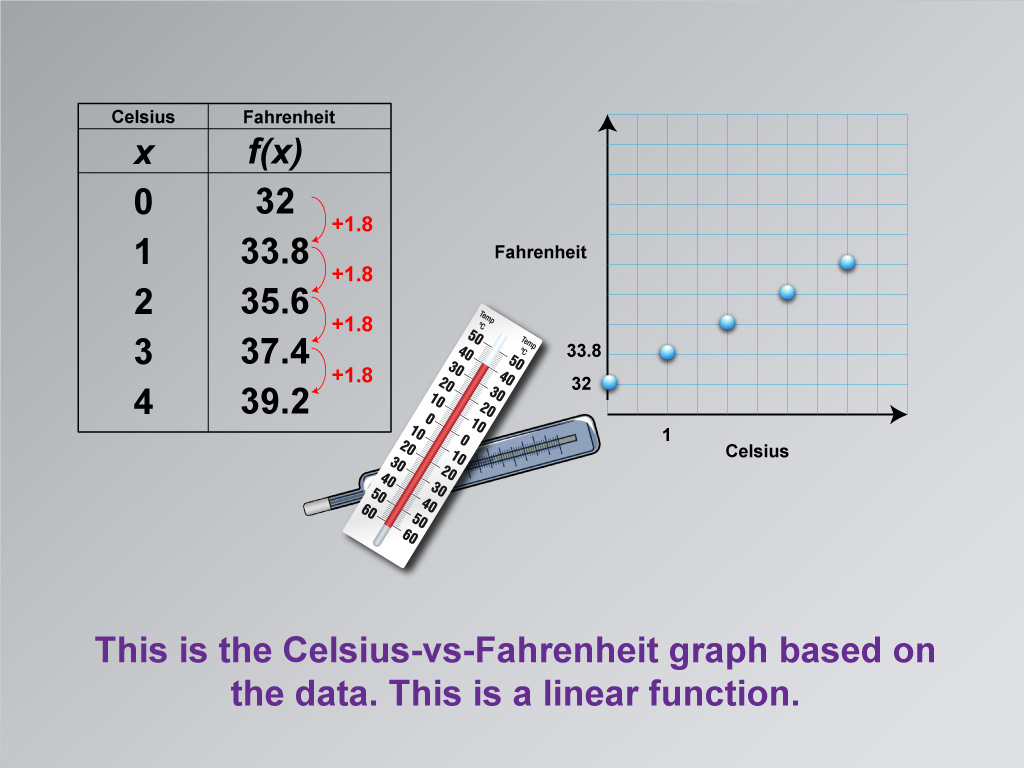
This image is part of a series illustrating applications of linear functions, focusing on temperature conversion. It builds upon previous images by introducing a data graph that visually represents the relationship between Celsius and Fahrenheit temperatures. The graph reinforces the key observation that for every degree Celsius increase, there is a corresponding 1.8° increase in the Fahrenheit temperature.
By presenting the data in both tabular and graphical forms, this image helps students visualize the linear relationship between the two temperature scales. The graph makes it easier to see the consistent rate of change, which is crucial for understanding the concept of slope in linear functions. This visual representation bridges the gap between abstract mathematical concepts and real-world applications.
Incorporating such math clip art into lessons on linear functions is highly effective. It provides a concrete, real-world context that makes abstract mathematical concepts more tangible and relatable. The progression from data table to graph helps students construct their understanding of linear relationships step by step, reinforcing the connection between different representations of the same information.
A teacher might introduce this image by saying: "Now that we've identified the pattern in our data table, let's look at how this relationship appears on a graph. Notice how the points form a straight line. What does this tell us about the relationship between Celsius and Fahrenheit temperatures? How does this graph help us understand the concept of slope in linear functions?"
For a complete collection of math clip art related to Applications of Linear Functions click on this link: Applications of Linear Functions: Temperature Conversion Collection.
| Common Core Standards | CCSS.MATH.CONTENT.8.F.A.2, CCSS.MATH.CONTENT.8.F.A.3, CCSS.MATH.CONTENT.HSF.LE.A.1.A |
|---|---|
| Grade Range | 8 - 10 |
| Curriculum Nodes |
Algebra • Linear Functions and Equations • Graphs of Linear Functions • Slope-Intercept Form |
| Copyright Year | 2021 |
| Keywords | linear functions |