Display Title
Math Clip Art--Function Concepts--Function Representations 06
Display Title
Math Clip Art--Function Concepts--Function Representations 06

Topic
Functions
Description
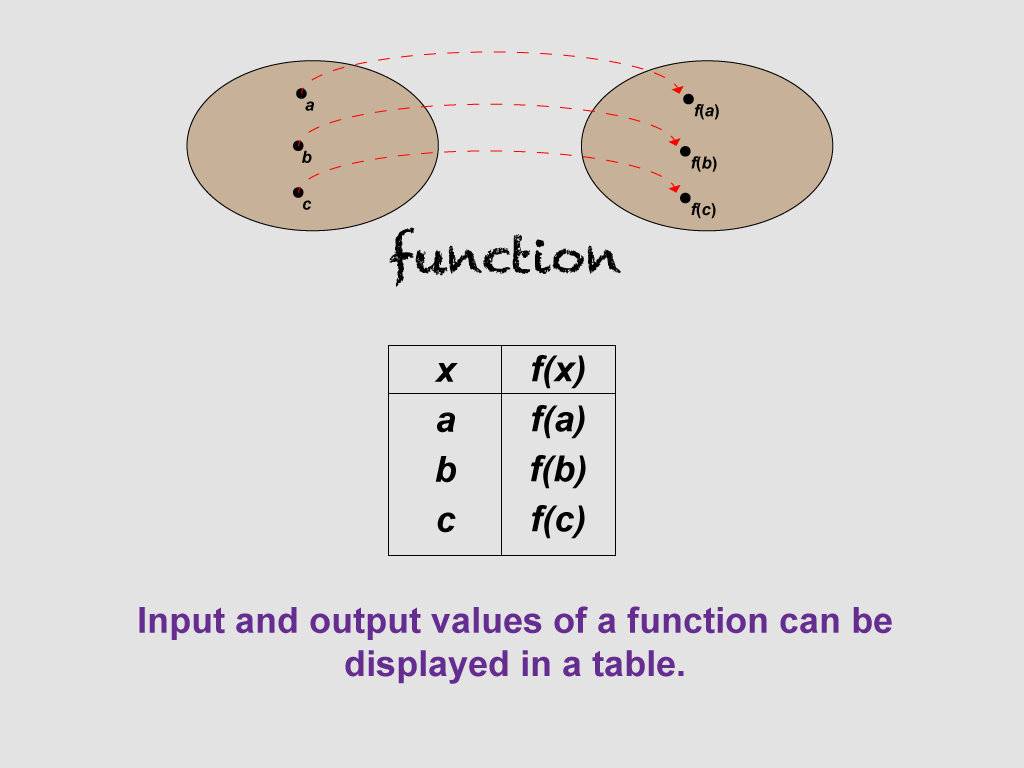
This image features a table displaying inputs 'a', 'b', and 'c' mapped to outputs f(a), f(b), and f(c). It visually represents how input and output values of a function can be organized in a tabular format, making it easier to analyze relationships.
Educators can use this image to teach students about the organization of function data. By presenting inputs and outputs in a table, students can clearly see how each input corresponds to an output, reinforcing their understanding of functions.
Math clip art like this is vital for teaching as it provides visual models that simplify complex concepts. Tables help students systematically explore input-output relationships, enhancing their comprehension of functions.
Teacher's Script: "Notice how each input has a corresponding output in this table. This format helps us see the function's pattern. Can you identify how the inputs relate to the outputs? What might happen if we added more inputs?"
For a complete collection of math clip art related to Functions click on this link: Function Representations Collection.
| Common Core Standards | CCSS.MATH.CONTENT.HSF.IF.A.1, CCSS.MATH.CONTENT.HSF.IF.A.2, CCSS.MATH.CONTENT.HSF.IF.C.8, CCSS.MATH.CONTENT.HSF.BF.A.1, CCSS.MATH.CONTENT.HSF.BF.A.1.A |
|---|---|
| Grade Range | 8 - 10 |
| Curriculum Nodes |
Algebra • Functions and Relations • Relations and Functions |
| Copyright Year | 2020 |
| Keywords | functions |