Display Title
Math Clip Art--Function Concepts--Function Representations 20
Display Title
Math Clip Art--Function Concepts--Function Representations 20

Topic
Functions
Description
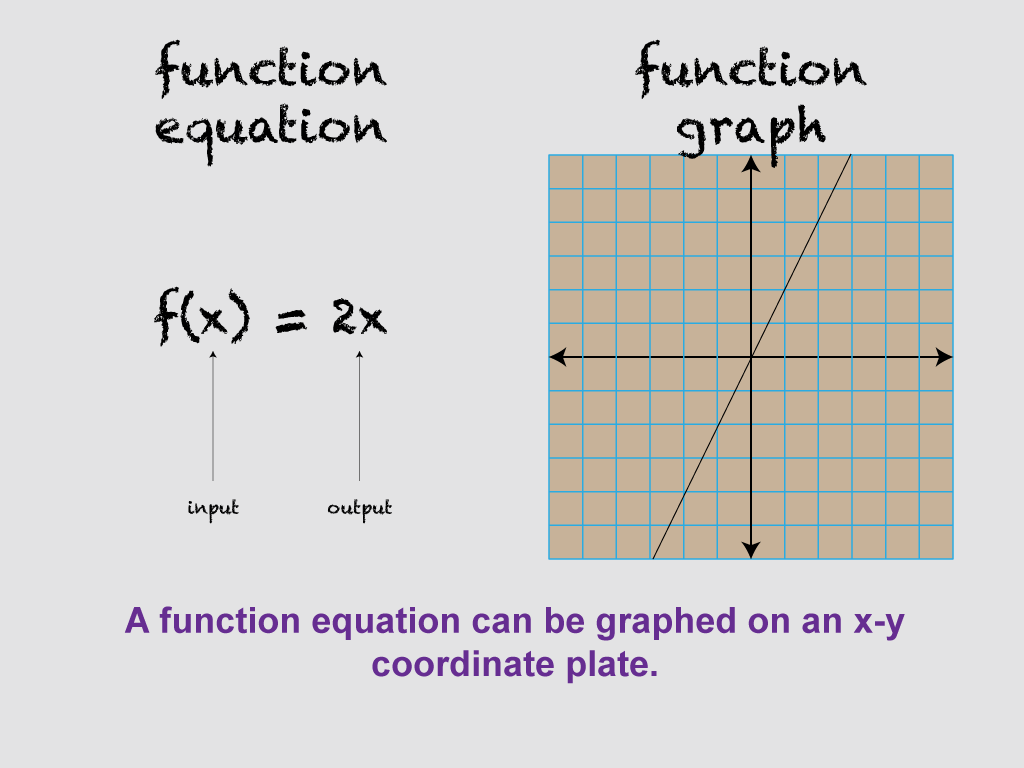
This image shows a function equation f(x) = 2x on the left side, labeled with "input" and "output." On the right, it displays a graph of this linear function on an x-y grid, illustrating how equations can be represented graphically.
This visual aids educators in demonstrating the connection between algebraic equations and their graphical representations, helping students visualize linear relationships.
The use of math clip art is essential in teaching as it provides visual models that make abstract ideas more tangible. Graphs help students understand relationships within functions.
Teacher's Script: "Look at how our equation becomes a line on the graph. How does this help us see the relationship between x and y? What patterns do you notice?"
For a complete collection of math clip art related to Functions click on this link: Function Representations Collection.
| Common Core Standards | CCSS.MATH.CONTENT.HSF.IF.A.1, CCSS.MATH.CONTENT.HSF.IF.A.2, CCSS.MATH.CONTENT.HSF.IF.C.8, CCSS.MATH.CONTENT.HSF.BF.A.1, CCSS.MATH.CONTENT.HSF.BF.A.1.A |
|---|---|
| Grade Range | 8 - 10 |
| Curriculum Nodes |
Algebra • Functions and Relations • Relations and Functions |
| Copyright Year | 2020 |
| Keywords | functions |