Display Title
Math Clip Art--Function Concepts--Graphs of Functions and Relations--Cosine Curve
Display Title
Math Clip Art--Function Concepts--Graphs of Functions and Relations--Cosine Curve

Topic
Functions
Description
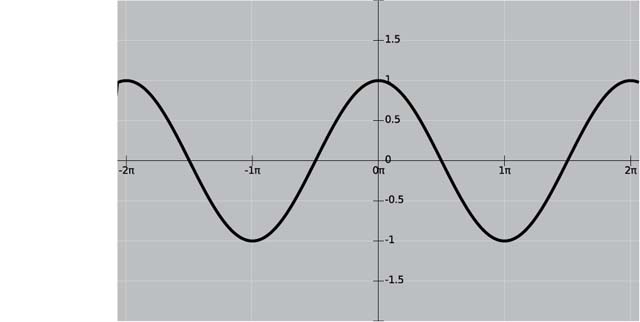
This clip art illustrates the cosine function, another fundamental trigonometric function. Like the sine function, the cosine curve is periodic and passes the vertical line test, confirming its status as a function. It oscillates smoothly between -1 and 1 on the y-axis.
The cosine function is similar to the sine function but shifted horizontally. This relationship between sine and cosine is crucial in trigonometry and has wide-ranging applications in physics, engineering, and signal processing. The cosine curve's shape helps visualize concepts like phase shift, amplitude, and frequency.
Using visual representations of functions like the cosine curve is invaluable in mathematics education. It allows students to see the cyclical nature of trigonometric functions and understand how changing parameters in the equation affects the graph. This visual approach can make abstract concepts more concrete and relatable.
Teacher's Script: "Notice how this curve is similar to the sine curve we saw earlier. Can you spot the differences? Let's discuss how we might transform this curve - what would happen if we changed its amplitude or shifted it left or right? Can you think of any real-world phenomena that might follow a cosine pattern?"
For a complete collection of math clip art related to Functions and Relations click on this link: Graphs of Functions and Relations Collection.
| Common Core Standards | CCSS.MATH.CONTENT.HSF.TF.B.5, CCSS.MATH.CONTENT.HSF.TF.B.6, CCSS.MATH.CONTENT.HSF.TF.B.7 |
|---|---|
| Grade Range | 8 - 12 |
| Curriculum Nodes |
Algebra • Trig Expressions and Functions • Trigonometric Functions |
| Copyright Year | 2014 |
| Keywords | clip art, Cosine Curve |