Display Title
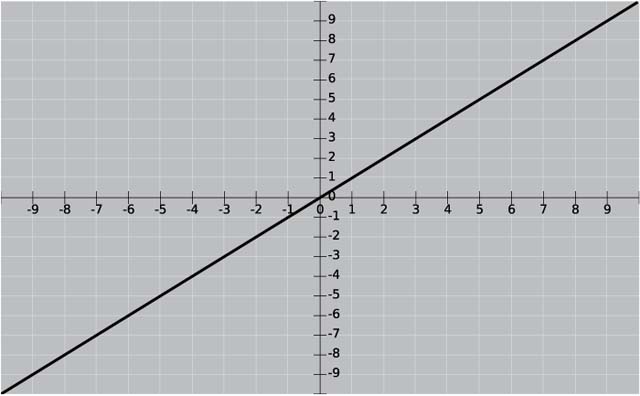
Math Clip Art--Function Concepts--Graphs of Functions and Relations--Linear Function Graph
Display Title
Math Clip Art--Function Concepts--Graphs of Functions and Relations--Linear Function Graph

Topic
Functions
Description
This clip art illustrates a linear function graph. Linear functions are the simplest type of function, represented by a straight line. They always pass the vertical line test, confirming their status as functions.
Linear functions are fundamental in mathematics and have widespread applications in various fields. They model constant rates of change and are often used as approximations for more complex relationships. The graph's slope represents the rate of change, while the y-intercept shows the initial value.
Visualizing linear functions helps students understand concepts like slope, intercepts, and the relationship between equations and graphs. This graph can be used to introduce more advanced topics like systems of equations and linear programming.
Teacher's Script: "Look at this straight line. Can you identify its slope and y-intercept? Let's discuss how changing these values affects the line's position and steepness. How might we use linear functions to model real-world situations?"
For a complete collection of math clip art related to Functions and Relations click on this link: Graphs of Functions and Relations Collection.
| Common Core Standards | CCSS.MATH.CONTENT.HSF.TF.B.5, CCSS.MATH.CONTENT.HSF.TF.B.6, CCSS.MATH.CONTENT.HSF.TF.B.7 |
|---|---|
| Grade Range | 8 - 12 |
| Curriculum Nodes |
Geometry • Points and Lines • Applications of Points and Lines |
| Copyright Year | 2014 |
| Keywords | Linear Function Graph, clip art |