Display Title
Math Clip Art--Function Concepts--Graphs of Functions and Relations--Logarithmic Function
Display Title
Math Clip Art--Function Concepts--Graphs of Functions and Relations--Logarithmic Function

Topic
Functions
Description
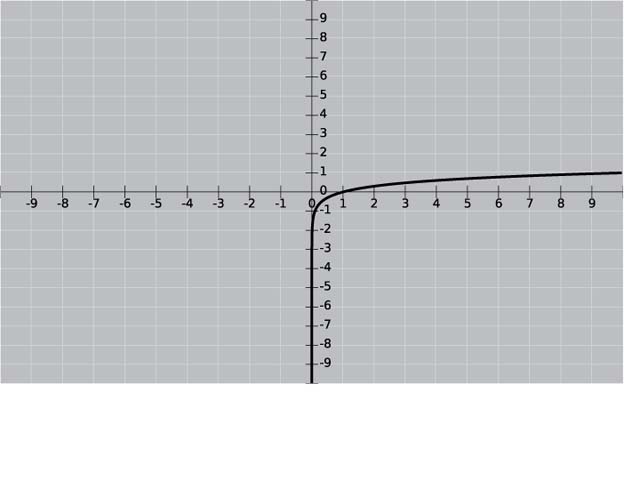
This clip art depicts a logarithmic function graph. Logarithmic functions are the inverse of exponential functions and are characterized by their distinctive curve that grows slowly as x increases. They pass the vertical line test and are thus functions.
Logarithmic functions are crucial in modeling various phenomena in science and nature, such as earthquake intensity, sound loudness, and compound interest. Their unique shape makes them useful for representing data across widely different scales.
Visualizing logarithmic functions helps students understand concepts like domain restrictions, asymptotic behavior, and the relationship between exponential and logarithmic functions. This graph can be used to introduce the properties of logarithms and their applications in solving exponential equations.
Teacher's Script: "Observe how this curve grows quickly at first, then slows down. Can you identify the vertical asymptote? Let's discuss why there's no y-intercept. How might logarithmic functions be useful in real-world applications?"
For a complete collection of math clip art related to Functions and Relations click on this link: Graphs of Functions and Relations Collection.
| Common Core Standards | CCSS.MATH.CONTENT.HSF.LE.A.4 |
|---|---|
| Grade Range | 8 - 12 |
| Curriculum Nodes |
Algebra • Exponential and Logarithmic Functions • Exponential and Logarithmic Functions and Equations • Graphs of Exponential and Logarithmic Functions |
| Copyright Year | 2014 |
| Keywords | Logarithmic Function, clip art |