Display Title
Math Clip Art--Function Concepts--Graphs of Functions and Relations--Sine Curve
Display Title
Math Clip Art--Function Concepts--Graphs of Functions and Relations--Sine Curve

Topic
Functions
Description
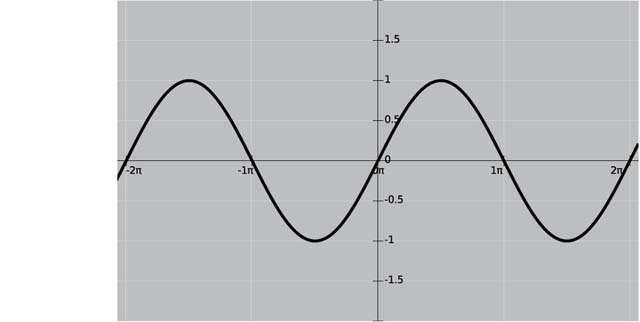
This clip art image showcases the sine function, a fundamental trigonometric function. The sine curve is a perfect example of a periodic function, repeating its values at regular intervals. It passes the vertical line test, confirming its status as a function.
The sine function is characterized by its smooth, wave-like pattern that oscillates between -1 and 1 on the y-axis. Its periodic nature makes it invaluable for modeling cyclical phenomena in various fields, from physics to engineering. This visual representation helps students grasp concepts like amplitude, period, and frequency.
Using such visual aids in teaching mathematics is crucial. The sine curve's distinctive shape helps students connect abstract trigonometric concepts with tangible, real-world applications. It serves as a gateway to understanding more complex oscillatory behaviors and wave mechanics.
Teacher's Script: "Observe this wave-like pattern. Can you identify its highest and lowest points? How often does it repeat? Let's discuss how changing the equation might affect the shape of this curve. Can you think of real-world phenomena that might follow a similar pattern?"
For a complete collection of math clip art related to Functions and Relations click on this link: Graphs of Functions and Relations Collection.
| Common Core Standards | CCSS.MATH.CONTENT.HSF.TF.B.5, CCSS.MATH.CONTENT.HSF.TF.B.6, CCSS.MATH.CONTENT.HSF.TF.B.7 |
|---|---|
| Grade Range | 8 - 12 |
| Curriculum Nodes |
Algebra • Trig Expressions and Functions • Trigonometric Functions |
| Copyright Year | 2014 |
| Keywords | clip art, Sine Curve |