Display Title
Math Clip Art--Linear Function Tables 07
Display Title
Math Clip Art--Linear Function Concepts--Linear Function Tables 07

Topic
Linear Functions
Description
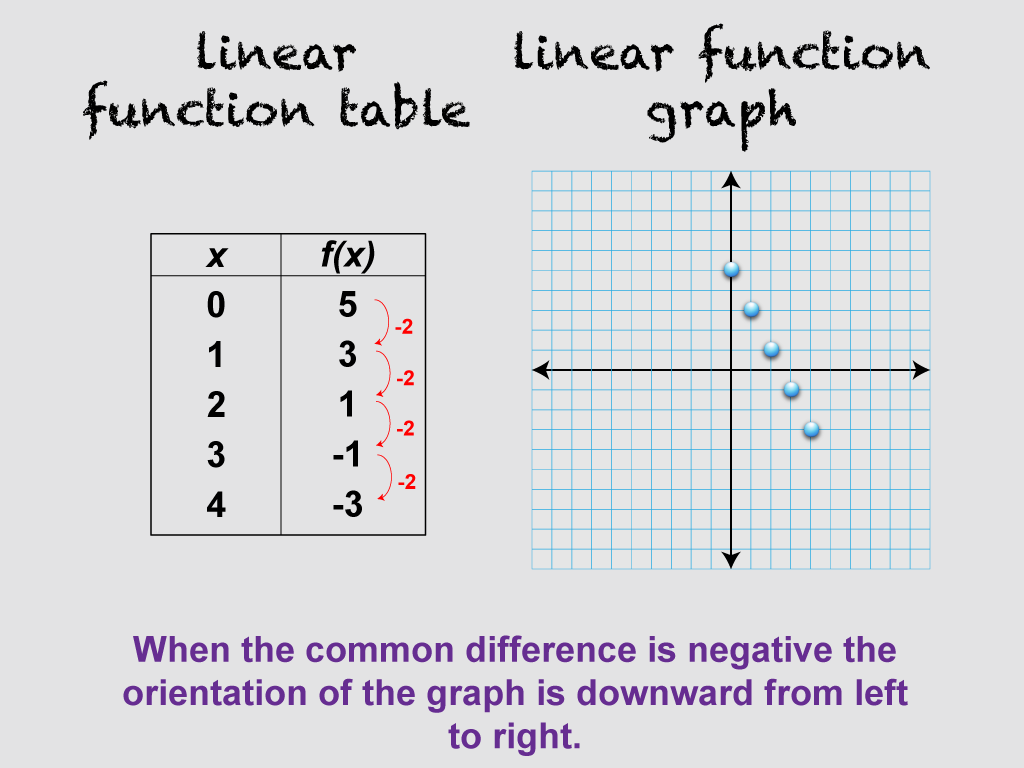
This image is part of a series illustrating key concepts in linear functions, focusing on linear function tables and their corresponding graphs. It shows a variation of the previous image with a new set of data, demonstrating that when the common difference is negative, the orientation of the graph is downward from left to right. This helps students understand the concept of negative slope in linear functions.
Teachers can use this image to deepen understanding by saying: "Now we have a different scenario. How does this table and graph differ from the last one? What does the downward slope tell us about the relationship between x and y? Can you think of real-world situations where we might see this kind of relationship?"
For a complete collection of math clip art related to Linear Functions click on this link: Linear Functions Concepts Collection.
| Common Core Standards | CCSS.MATH.CONTENT.8.F.A.2, CCSS.MATH.CONTENT.8.F.A.3, CCSS.MATH.CONTENT.HSF.LE.A.1.A, CCSS.MATH.CONTENT.5.OA.B.3 |
|---|---|
| Grade Range | 8 - 10 |
| Curriculum Nodes |
Algebra • Linear Functions and Equations • Graphs of Linear Functions • Slope-Intercept Form |
| Copyright Year | 2021 |
| Keywords | linear functions, Proportional |