Display Title
Math Clip Art--Linear Function Tables 08
Display Title
Math Clip Art--Linear Function Concepts--Linear Function Tables 08

Topic
Linear Functions
Description
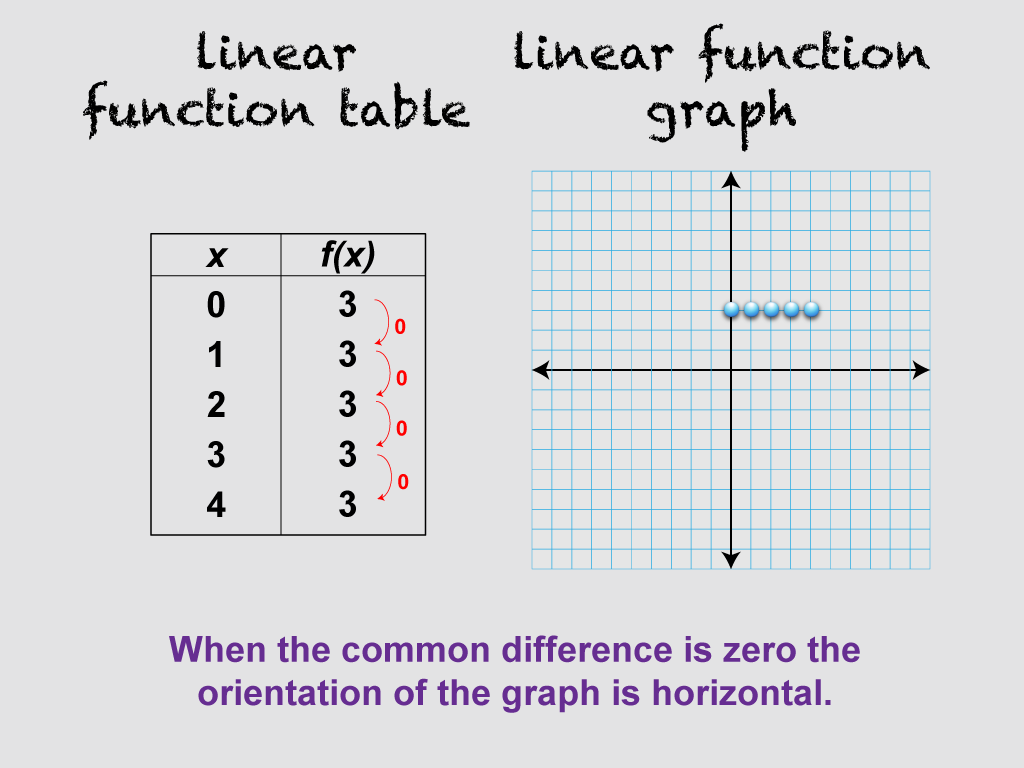
This image is part of a series illustrating key concepts in linear functions, focusing on linear function tables and their corresponding graphs. It presents a variation of the previous image with a new set of data, showing that when the common difference is zero, the orientation of the graph is horizontal. This helps students understand the concept of zero slope in linear functions, also known as constant functions.
Teachers can engage students with this image by saying: "Let's analyze this new table and graph. What's unique about the y-values in the table? How does this translate to the graph? Why do you think this line is horizontal? Can you think of any real-world scenarios where a quantity might remain constant over time?"
For a complete collection of math clip art related to Linear Functions click on this link: Linear Functions Concepts Collection.
| Common Core Standards | CCSS.MATH.CONTENT.8.F.A.2, CCSS.MATH.CONTENT.8.F.A.3, CCSS.MATH.CONTENT.HSF.LE.A.1.A, CCSS.MATH.CONTENT.5.OA.B.3 |
|---|---|
| Grade Range | 8 - 10 |
| Curriculum Nodes |
Algebra • Linear Functions and Equations • Graphs of Linear Functions • Slope-Intercept Form |
| Copyright Year | 2021 |
| Keywords | linear functions, Proportional |