Display Title
Math Clip Art--Linear Function Tables 09
Display Title
Math Clip Art--Linear Function Concepts--Linear Function Tables 09

Topic
Linear Functions
Description
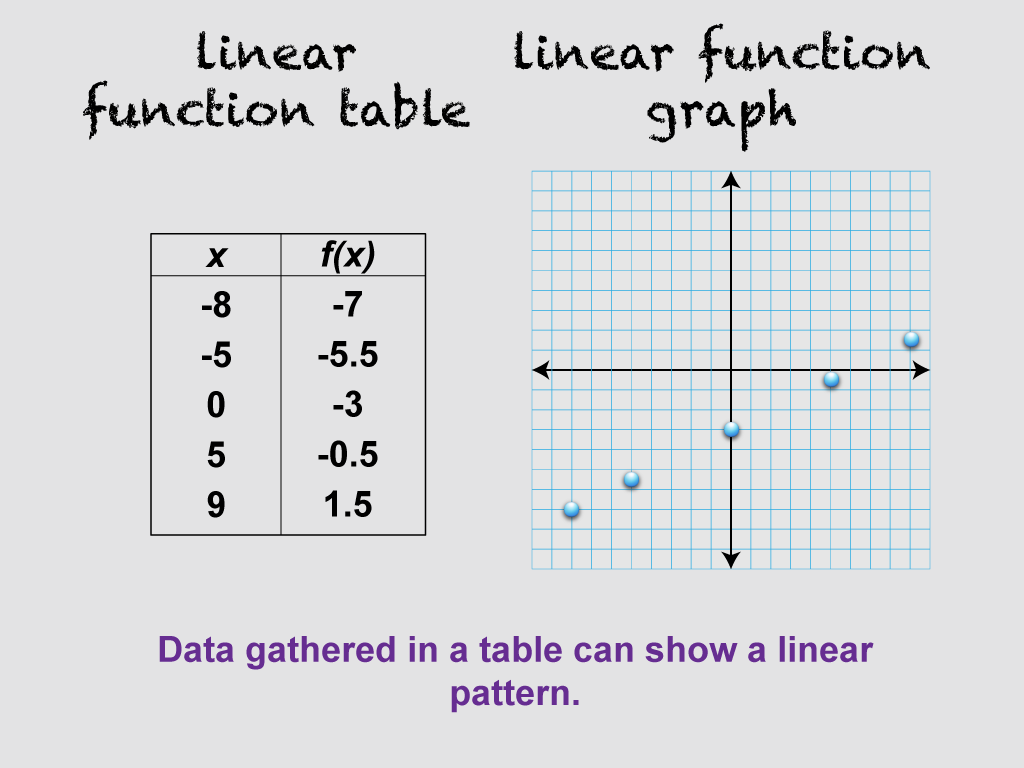
This image is part of a series illustrating key concepts in linear functions, focusing on linear function tables. It shows a variation of the previous image with a new set of data, demonstrating that data gathered in a table can show a linear pattern. This concept helps students understand how to identify linear relationships from tabular data.
Teachers can use this image to develop analytical skills by saying: "Look at this table carefully. What patterns do you notice in the data? How can we tell if a relationship is linear just by looking at a table? What characteristics should we look for? How might this data look if we graphed it?"
For a complete collection of math clip art related to Linear Functions click on this link: Linear Functions Concepts Collection.
| Common Core Standards | CCSS.MATH.CONTENT.8.F.A.2, CCSS.MATH.CONTENT.8.F.A.3, CCSS.MATH.CONTENT.HSF.LE.A.1.A, CCSS.MATH.CONTENT.5.OA.B.3 |
|---|---|
| Grade Range | 8 - 10 |
| Curriculum Nodes |
Algebra • Linear Functions and Equations • Graphs of Linear Functions • Slope-Intercept Form |
| Copyright Year | 2021 |
| Keywords | linear functions, Proportional |