
Display Title
Math Clip Art--Linear Functions Concepts--Graphs of Linear Functions 2
Display Title
Math Clip Art--Linear Functions Concepts--Graphs of Linear Functions 2
Topic
Linear Functions
Description
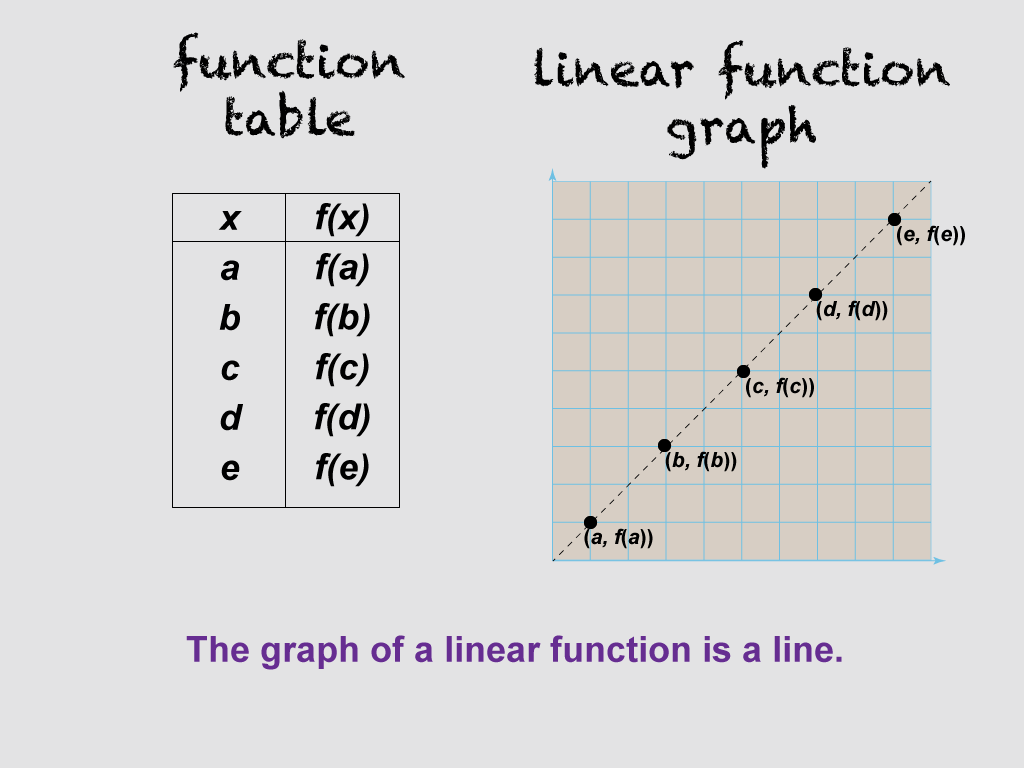
This image presents a data table alongside a linear graph with the slope and y-intercept labeled. It demonstrates the connection between tabular data and graphical representation of linear functions, helping students understand how numerical values translate into visual patterns.
By incorporating this visual aid, teachers can enhance students' comprehension of the relationship between data points and their graphical representation. This image serves as a bridge between algebraic and geometric interpretations of linear functions.
Teachers can engage students with this image by saying: "Look at how the data in the table corresponds to points on the graph. Can you identify the slope and y-intercept from both the table and the graph? How do these elements affect the line's position and steepness?"
For a complete collection of math clip art related to Linear Functions click on this link: Linear Functions Concepts Collection.
| Common Core Standards | CCSS.MATH.CONTENT.8.F.A.2, CCSS.MATH.CONTENT.8.F.A.3, CCSS.MATH.CONTENT.HSF.LE.A.1.A, CCSS.MATH.CONTENT.HSA.REI.D.11 |
|---|---|
| Grade Range | 8 - 10 |
| Curriculum Nodes |
Algebra • Linear Functions and Equations • Graphs of Linear Functions • Slope-Intercept Form |
| Copyright Year | 2021 |
| Keywords | linear functions, Proportional |