Display Title
Math Clip Art--Linear Functions Concepts--Graphs of Linear Functions 3
Display Title
Math Clip Art--Linear Functions Concepts--Graphs of Linear Functions 3

Topic
Linear Functions
Description
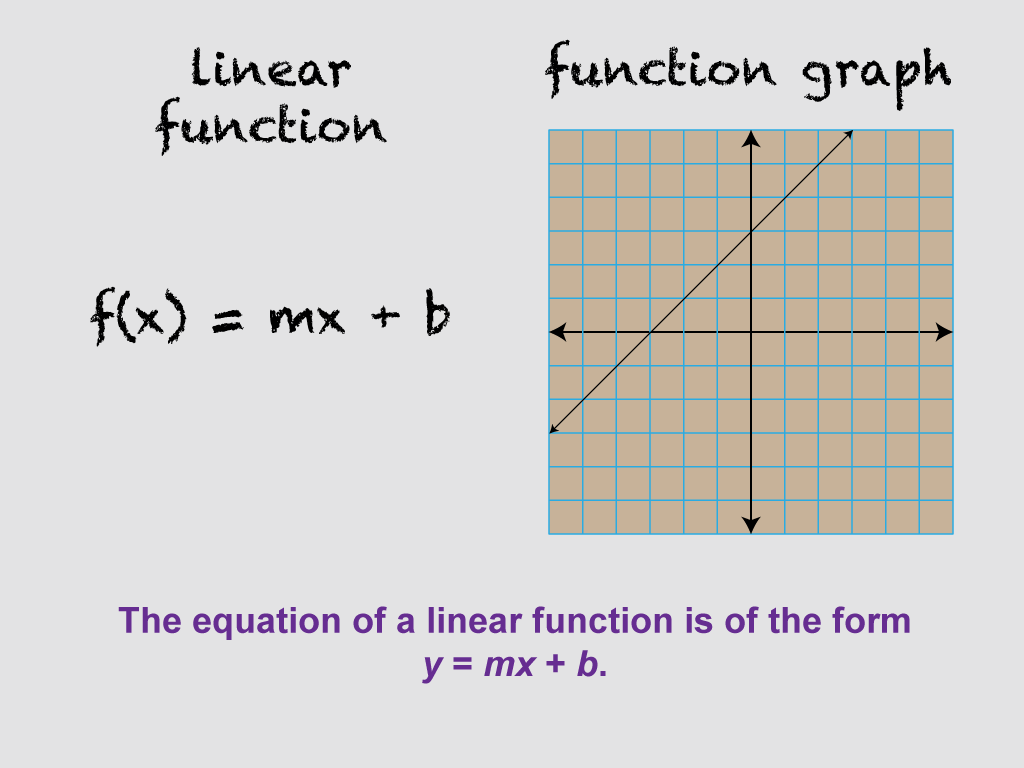
This image displays the general form of the slope-intercept equation (y = mx + b) with definitions of m and b. It provides a crucial link between the algebraic representation of linear functions and their graphical interpretation, helping students understand how each component of the equation affects the graph.
Using this visual aid can significantly enhance students' understanding of the slope-intercept form and its relationship to linear graphs. It serves as a reference point for discussing how changes in m and b impact the line's appearance on a coordinate plane.
Teachers can use this image to explain the slope-intercept form by saying: "This equation, y = mx + b, is the key to understanding linear functions. Let's break it down: 'm' represents the slope, and 'b' represents the y-intercept. How do you think changing these values would affect the graph of the line?"
For a complete collection of math clip art related to Linear Functions click on this link: Linear Functions Concepts Collection.
| Common Core Standards | CCSS.MATH.CONTENT.8.F.A.2, CCSS.MATH.CONTENT.8.F.A.3, CCSS.MATH.CONTENT.HSF.LE.A.1.A, CCSS.MATH.CONTENT.HSA.REI.D.11 |
|---|---|
| Grade Range | 8 - 10 |
| Curriculum Nodes |
Algebra • Linear Functions and Equations • Graphs of Linear Functions • Slope-Intercept Form |
| Copyright Year | 2021 |
| Keywords | linear functions, Proportional |