Display Title
Math Clip Art--Linear Functions Concepts--Linear Function Representations 14
Display Title
Math Clip Art--Linear Functions Concepts--Linear Function Representations 14

Topic
Linear Functions
Description
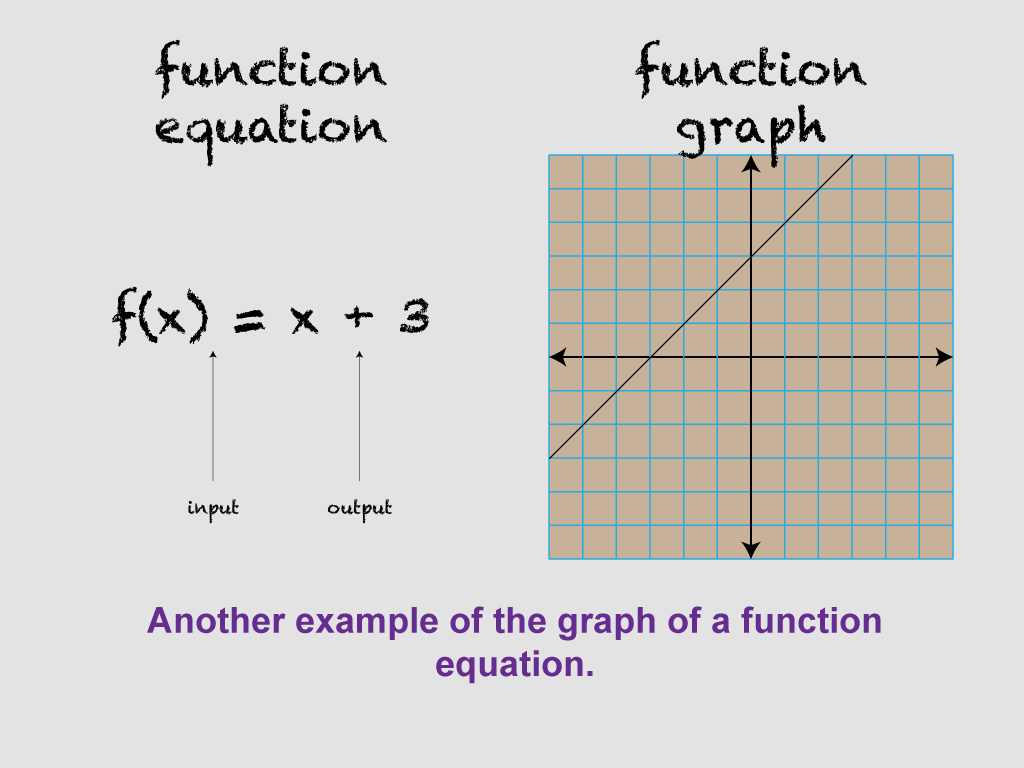
This image presents a variation of the previous image, now showing the equation and graph of f(x) = x + 3. It provides another example of how a function equation can be represented graphically, allowing students to compare and contrast different linear functions.
By incorporating this visual aid, teachers can help students understand how changes in the equation affect the graph of a linear function. This image is particularly useful for discussing the effects of slope and y-intercept on the position and steepness of the line.
Teachers can use this image to reinforce concepts by saying: "Here's another example of a function equation and its graph. How does this graph differ from the previous one? What do these differences tell us about the equation? Can you identify the y-intercept on this graph? How would you describe the slope of this line compared to the last one?"
For a complete collection of math clip art related to Linear Functions click on this link: Linear Functions Concepts Collection.
| Common Core Standards | CCSS.MATH.CONTENT.8.F.A.2, CCSS.MATH.CONTENT.8.F.A.3, CCSS.MATH.CONTENT.HSF.LE.A.1.A |
|---|---|
| Grade Range | 8 - 10 |
| Curriculum Nodes |
Algebra • Linear Functions and Equations • Graphs of Linear Functions • Slope-Intercept Form |
| Copyright Year | 2021 |
| Keywords | linear functions |