Display Title
Math Clip Art--Linear Functions Concepts--Linear Function Representations 2
Display Title
Math Clip Art--Linear Functions Concepts--Linear Function Representations 2

Topic
Linear Functions
Description
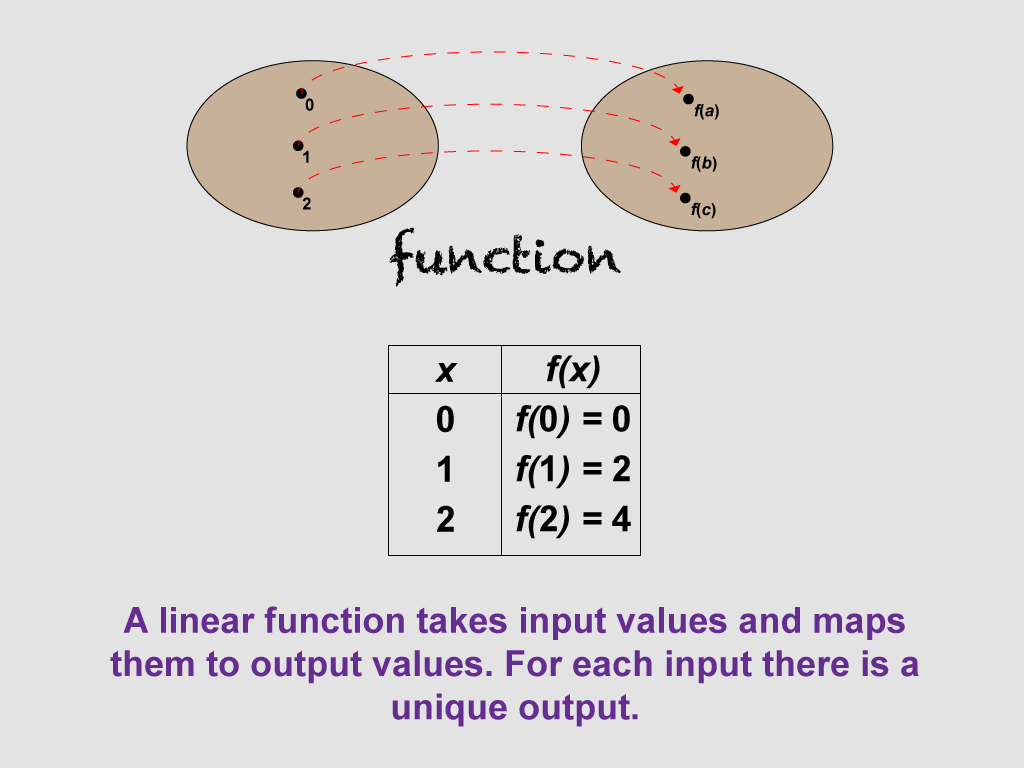
This image presents a function mapping and a table of values, illustrating how a linear function takes input values and maps them to unique output values. It helps students understand the fundamental concept of functions and their representation in tabular form.
By incorporating this visual aid, teachers can enhance students' comprehension of the input-output relationship in linear functions. This image serves as a bridge between the abstract concept of functions and their concrete representation in tables.
Teachers can engage students with this image by saying: "Look at how each input value corresponds to a unique output value. Can you see the pattern in the table? How does this relate to our understanding of linear functions? Can you predict what the next row in the table might be?"
For a complete collection of math clip art related to Linear Functions click on this link: Linear Functions Concepts Collection.
| Common Core Standards | CCSS.MATH.CONTENT.8.F.A.2, CCSS.MATH.CONTENT.8.F.A.3, CCSS.MATH.CONTENT.HSF.LE.A.1.A |
|---|---|
| Grade Range | 8 - 10 |
| Curriculum Nodes |
Algebra • Linear Functions and Equations • Graphs of Linear Functions • Slope-Intercept Form |
| Copyright Year | 2021 |
| Keywords | linear functions |