Display Title
Math Clip Art--Linear Functions Concepts--Linear Function Representations 3
Display Title
Math Clip Art--Linear Functions Concepts--Linear Function Representations 3

Topic
Linear Functions
Description
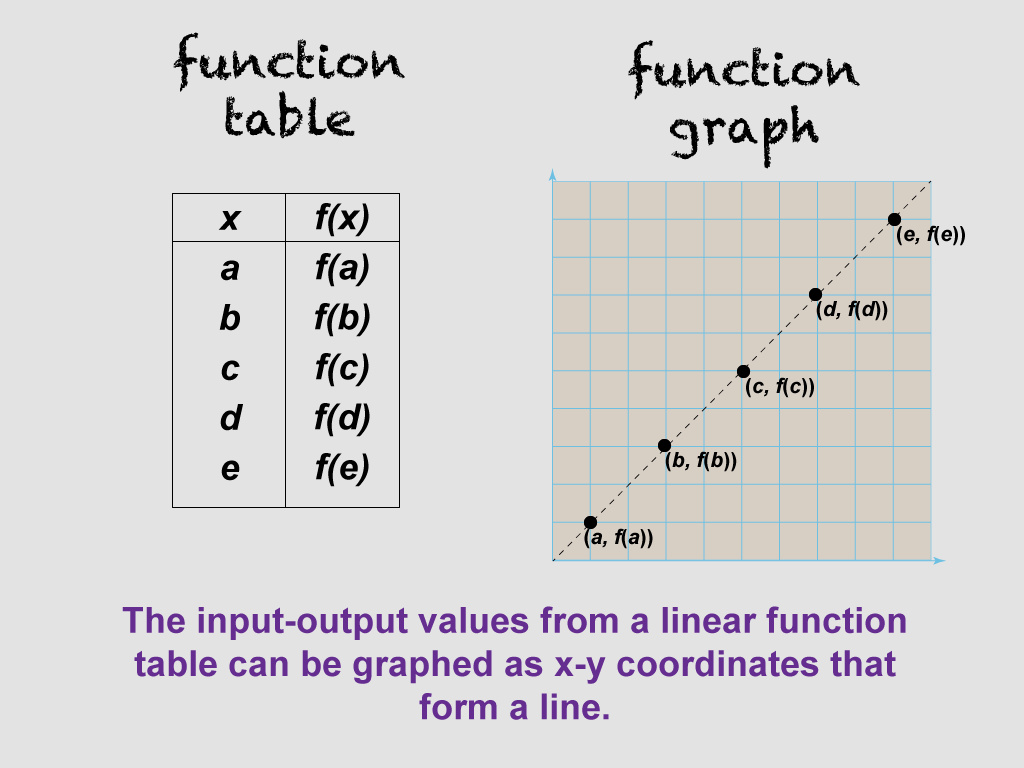
This image shows a function table alongside a linear graph, demonstrating how the input-output values from a linear function table can be graphed as x-y coordinates that form a line. It helps students visualize the connection between tabular and graphical representations of linear functions.
By using this visual aid, teachers can help students understand how to translate data from a table into a graph. This image is particularly useful for students who benefit from seeing the direct relationship between different representations of the same function.
Teachers can guide students through this image by saying: "Let's look at how the values in our table correspond to points on the graph. Can you identify which column represents the x-coordinates and which represents the y-coordinates? Notice how these points form a straight line when plotted. What does this tell us about the relationship between x and y?"
For a complete collection of math clip art related to Linear Functions click on this link: Linear Functions Concepts Collection.
| Common Core Standards | CCSS.MATH.CONTENT.8.F.A.2, CCSS.MATH.CONTENT.8.F.A.3, CCSS.MATH.CONTENT.HSF.LE.A.1.A |
|---|---|
| Grade Range | 8 - 10 |
| Curriculum Nodes |
Algebra • Linear Functions and Equations • Graphs of Linear Functions • Slope-Intercept Form |
| Copyright Year | 2021 |
| Keywords | linear functions |