Display Title
Math Clip Art--Linear Functions Concepts--Linear Function Representations 4
Display Title
Math Clip Art--Linear Functions Concepts--Linear Function Representations 4

Topic
Linear Functions
Description
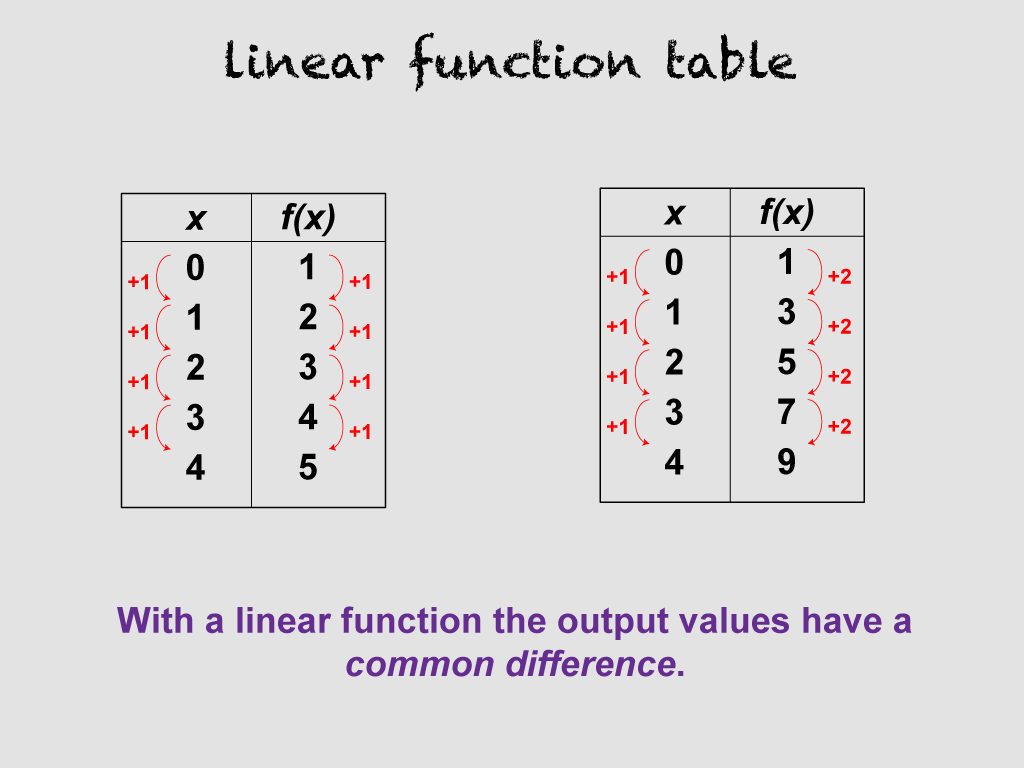
This image presents two data tables with common differences highlighted, illustrating that in a linear function, the output values have a common difference. This concept is crucial for understanding the constant rate of change in linear functions.
By incorporating this visual aid, teachers can help students recognize patterns in linear functions and understand how these patterns relate to the function's behavior. This image is particularly useful for introducing the concept of slope in a tabular context.
Teachers can use this image to explain the concept of common difference by saying: "Look at these two tables. Can you spot the pattern in the output values? Notice how the difference between consecutive outputs is always the same. This 'common difference' is a key feature of linear functions. How might this relate to the graph of the function?"
For a complete collection of math clip art related to Linear Functions click on this link: Linear Functions Concepts Collection.
| Common Core Standards | CCSS.MATH.CONTENT.8.F.A.2, CCSS.MATH.CONTENT.8.F.A.3, CCSS.MATH.CONTENT.HSF.LE.A.1.A |
|---|---|
| Grade Range | 8 - 10 |
| Curriculum Nodes |
Algebra • Linear Functions and Equations • Graphs of Linear Functions • Slope-Intercept Form |
| Copyright Year | 2021 |
| Keywords | linear functions |