Display Title
Math Clip Art--Quadratics Concepts--Equations of Parabolas 09
Display Title
Math Clip Art--Quadratics Concepts--Equations of Parabolas 09

Topic
Quadratics
Description
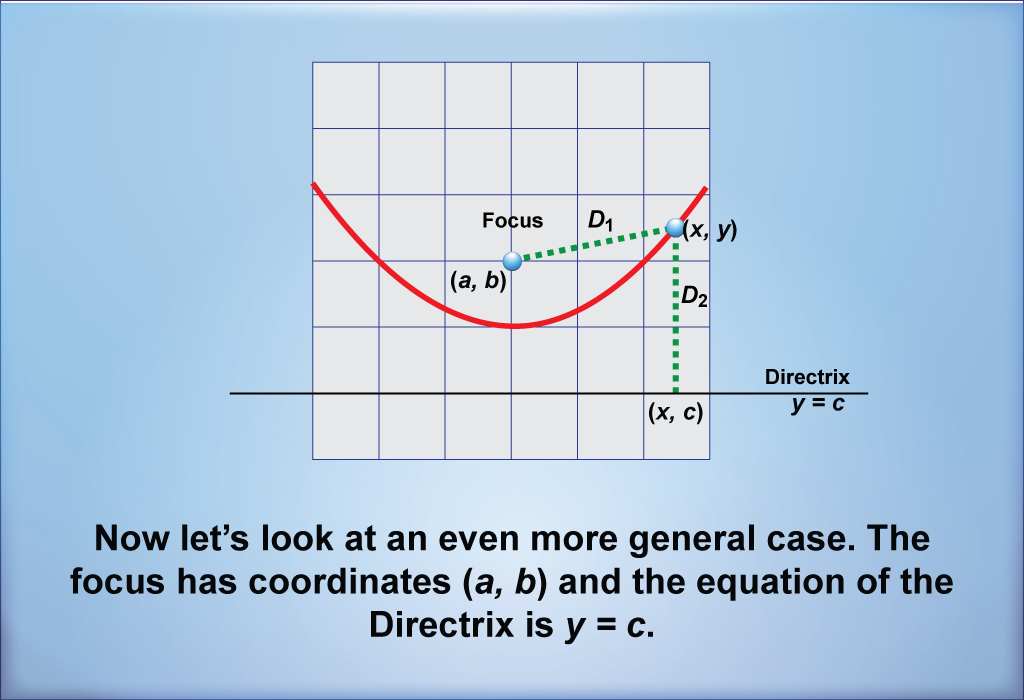
The ninth image in this collection visually reinforces the concepts previously introduced. It illustrates a graph of a parabola with a focus point (a, b), directrix y = c, and marking the distances D1 and D2. This composition emphasizes the link between the geometric definition of a parabola and its mathematical function.
This particular image is instrumental in illustrating how these distances, D1, the distance from the point to the focus, and D2, the distance to the directrix, can be compared. Students can evaluate how the positioning of the focus and directrix relates to the parabola's equation. Teachers may take this opportunity to draw out graphs and show varying positions of the directrix and how it affects the parabola's stance.
Using math clip art like this promotes a deeper understanding of quadratic relationships. Students are not only shown the parabolic shape but are also exposed to how visual representations correlate with the corresponding equations.
Teacher's Script: "Look closely at the differences in distance between points we analyze on the graph. What patterns do you see? Let's compare these distances to our knowledge of parabola equations."
For a complete collection of math clip art related to Parabolas click on this link: Equations of Parabolas Collection.
| Common Core Standards | CCSS.MATH.CONTENT.HSF.IF.C.7, CCSS.MATH.CONTENT.HSF.IF.C.7.A, CCSS.MATH.CONTENT.HSG.GPE.A.2 |
|---|---|
| Grade Range | 8 - 10 |
| Curriculum Nodes |
Algebra • Quadratic Functions and Equations • Graphs of Quadratic Functions |
| Copyright Year | 2021 |
| Keywords | quadratic functions, focus, directrix |