Display Title
Math Clip Art--Ratios, Proportions, Percents--Percent Change 09
Display Title
Math Clip Art--Ratios, Proportions, Percents--Percent Change 09

Topic
Ratios, Proportions, and Percents
Description
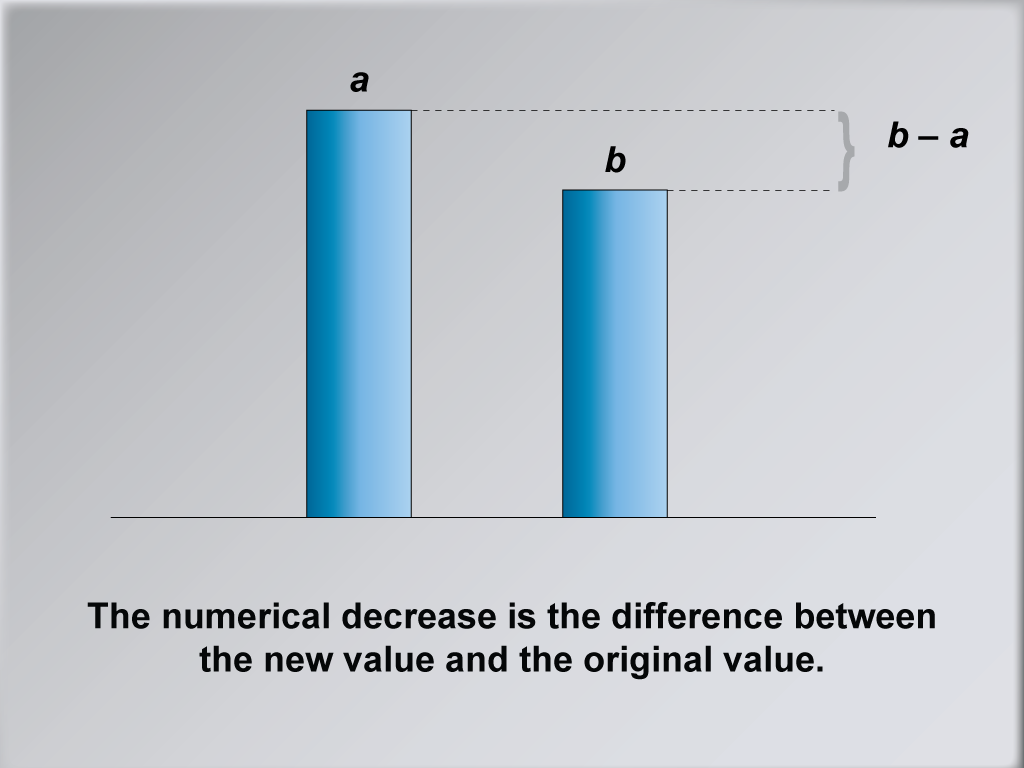
This image explains that numerical decrease is the difference between the new and original values. It mirrors the earlier explanation of numerical increase, ensuring consistency in presenting both cases.
Math clip art provides a visual and engaging way to explore complex mathematical concepts such as percent change. These examples illustrate how numbers, fractions, and percentages are interconnected, helping to build students' numerical reasoning skills.
Using visual tools in math instruction is critical because they make abstract concepts tangible. Clip art and other visual aids help students understand and retain complex information by presenting it in a concrete, relatable manner.
Teacher’s Script: Let's explore this example to see how percent change is calculated. In this case, we see that numerical decrease is the difference between the new and original values. These images are designed to help us see the relationships between numbers and percentages clearly. By examining these visuals, you'll build a stronger understanding of percent changes and how they apply in real-world scenarios.
For a complete collection of math clip art related to Ratios, Proportions, and Percents click on this link: Math Clip Art: Percent Change Collection.
| Common Core Standards | CCSS.MATH.CONTENT.6.RP.A.3.C, CCSS.MATH.CONTENT.7.RP.A.3 |
|---|---|
| Grade Range | 6 - 8 |
| Curriculum Nodes |
Algebra • Ratios, Proportions, and Percents • Percents |
| Copyright Year | 2021 |
| Keywords | percent change, percent increase, percent decrease |