Display Title
Math Clip Art--Ratios, Proportions, Percents--Rates 05
Display Title
Math Clip Art--Ratios, Proportions, Percents--Rates 05

Topic
Ratios, Proportions, and Percents
Description
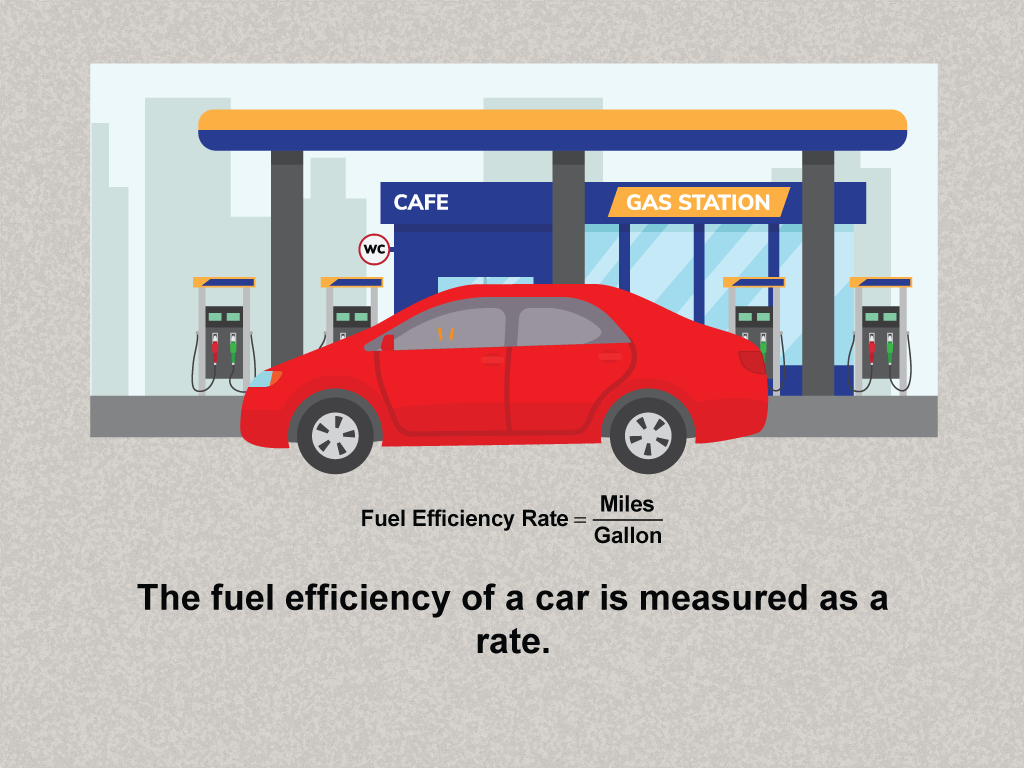
The image depicts a car with the formula Fuel Efficiency Rate = Miles / Gallon, explaining how fuel efficiency is measured as a rate. It introduces a third example of rates, connecting to environmental and economic considerations, and further solidifying understanding.
Ratios, Proportions, and Percents focuses on understanding and applying the concept of rates, which are comparisons of two quantities with different units.
The examples in this collection provide real-world contexts, such as gas stations, runners, and grocery stores, to help students make meaningful connections to the concept of rates. These scenarios bridge theoretical knowledge with practical application.
Visual tools and math clip art are crucial in teaching mathematical concepts as they help students visualize abstract ideas. They provide a reference point for discussion and enable better comprehension.
Teacher's Script: Today we are exploring rates through visual examples. Take a look at this image: The image depicts a car with the formula Fuel Efficiency Rate = Miles / Gallon, explaining how fuel efficiency is measured as a rate. This example helps us understand rates by connecting mathematical concepts to real-world contexts. The entire collection features similar illustrations, each designed to build a deeper understanding of rates and how they are applied.
For a complete collection of math clip art related to Rates click on this link: Math Clip Art: Rates Collection.
| Common Core Standards | CCSS.MATH.CONTENT.6.RP.A.2, CCSS.MATH.CONTENT.6.RP.A.3 |
|---|---|
| Grade Range | 6 - 8 |
| Curriculum Nodes |
Algebra • Ratios, Proportions, and Percents • Ratios and Rates |
| Copyright Year | 2021 |
| Keywords | ratios |