Display Title
Math Clip Art: Spinner, 10 Sections--Result 10
Display Title
Math Clip Art: Spinner, 10 Sections--Result 10

Topic
Probability and Statistics
Description
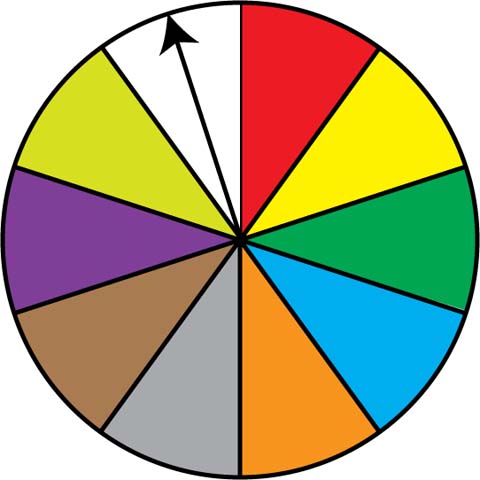
This image depicts a spinner divided into ten equal sections, which are colored red, yellow, green, light blue, orange, grey, brown, purple, yellow-green, and white. The spinner's arrow points to the white section, demonstrating the final possible outcome in this probability model.
In the field of Probability and Statistics, this spinner exemplifies a uniform probability distribution with ten equally likely outcomes. Each spin has a 1/10 probability of landing on any given color, illustrating the concept of equiprobable events in a complex scenario.
Teachers can leverage this complete set of images to explore topics such as expected value, variance, and the relationship between theoretical and experimental probability in multi-outcome scenarios. Students can conduct simulations, record data, and analyze the results to deepen their understanding of probabilistic concepts.
Utilizing math clip art like this spinner series provides a powerful visual tool for making abstract statistical ideas more concrete and accessible. It enables students to engage with probability concepts in a hands-on manner, fostering a deeper intuition for statistical thinking and its real-world applications with multiple variables.
Teacher's Script: "With the spinner landing on white, we've now seen all ten possible outcomes. Let's reflect on the entire series of spins. How do these results compare to our initial expectations? Can you calculate the experimental probability for each color based on our trials? How might these results change if we increased the number of spins significantly? Let's discuss how this relates to the concept of long-run probability and its applications in complex real-world situations with multiple outcomes."
For a complete collection of math clip art related to Probability and Statistics, click on this link: Probability Models: Spinners Collection.
| Common Core Standards | CCSS.MATH.CONTENT.7.SP.C.7, CCSS.MATH.CONTENT.7.SP.C.7.A, CCSS.MATH.CONTENT.7.SP.C.7.B |
|---|---|
| Grade Range | 6 - 12 |
| Curriculum Nodes |
Algebra • Probability and Data Analysis • Probability |
| Copyright Year | 2014 |
| Keywords | probability, statistics, data analysis, math clip art, clip art, clipart |