Display Title
Math Clip Art: Spinner, 10 Sections--Result 7
Display Title
Math Clip Art: Spinner, 10 Sections--Result 7

Topic
Probability and Statistics
Description
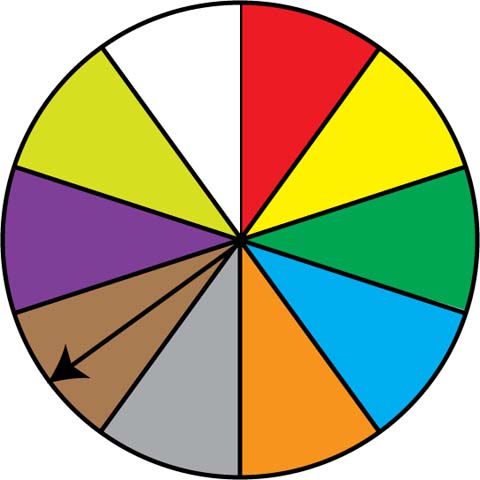
This image depicts a spinner divided into ten equal sections, which are colored red, yellow, green, light blue, orange, grey, brown, purple, yellow-green, and white. The spinner's arrow points to the brown section, demonstrating one of the possible outcomes.
In the context of Probability and Statistics, this spinner represents a probability experiment with ten equally likely outcomes. It visually demonstrates the concepts of sample space and individual events within that space, each with a 1/10 probability of occurrence.
Using such math clip art allows students to visualize probability concepts, seeing how theoretical probabilities translate into applied scenarios.
Teacher's Script: "Now we see the spinner landing on brown. Let's calculate the probability of getting brown followed by red in two consecutive spins. How does this relate to the multiplication rule of probability?"
For a complete collection of math clip art related to Probability and Statistics, click on this link: Probability Models: Spinners Collection.
| Common Core Standards | CCSS.MATH.CONTENT.7.SP.C.7, CCSS.MATH.CONTENT.7.SP.C.7.A, CCSS.MATH.CONTENT.7.SP.C.7.B |
|---|---|
| Grade Range | 6 - 12 |
| Curriculum Nodes |
Algebra • Probability and Data Analysis • Probability |
| Copyright Year | 2014 |
| Keywords | probability, statistics, data analysis, math clip art, clip art, clipart |