Display Title
Math Clip Art: Spinner, 10 Sections--Result 9
Display Title
Math Clip Art: Spinner, 10 Sections--Result 9

Topic
Probability and Statistics
Description
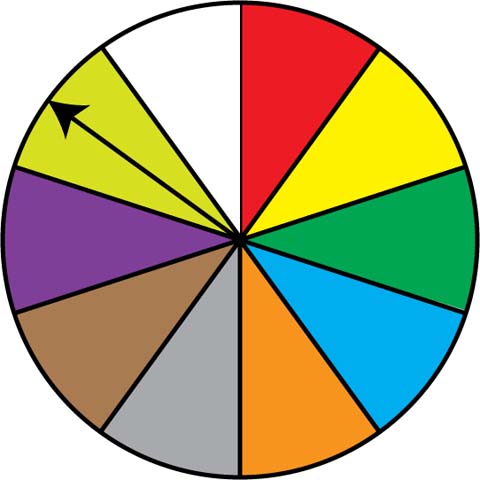
This image depicts a spinner divided into ten equal sections, which are colored red, yellow, green, light blue, orange, grey, brown, purple, yellow-green, and white. The spinner's arrow points to the yellow-green section, demonstrating one of the possible outcomes.
In the context of Probability and Statistics, this spinner represents a probability experiment with ten equally likely outcomes. It visually demonstrates the concepts of sample space and individual events within that space, each with a 1/10 probability of occurrence.
Using such math clip art allows students to visualize probability concepts, seeing how theoretical probabilities translate into applied scenarios.
Teacher's Script: "We've now seen the spinner land on yellow-green. Let's consider the probability of getting any 'green' color (green or yellow-green) in a single spin. How does this relate to the concept of compound events?"
For a complete collection of math clip art related to Probability and Statistics, click on this link: Probability Models: Spinners Collection.
| Common Core Standards | CCSS.MATH.CONTENT.7.SP.C.7, CCSS.MATH.CONTENT.7.SP.C.7.A, CCSS.MATH.CONTENT.7.SP.C.7.B |
|---|---|
| Grade Range | 6 - 12 |
| Curriculum Nodes |
Algebra • Probability and Data Analysis • Probability |
| Copyright Year | 2014 |
| Keywords | probability, statistics, data analysis, math clip art, clip art, clipart |