Display Title
Math Clip Art: Spinner, 4 Sections--Result 1
Display Title
Math Clip Art: Spinner, 4 Sections--Result 1

Topic
Probability and Statistics
Description
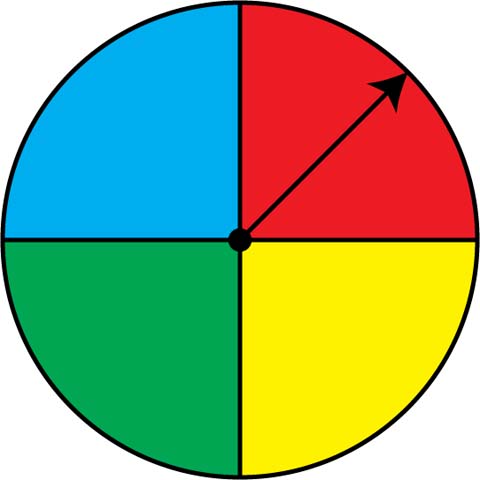
This image features a spinner divided into four equal segments: red, yellow, green, and blue. The spinner's arrow points to the red section, depicting a sample outcome in this probability model.
This spinner model is part of Probability and Statistics, as it visually exemplifies an experimental probability experiment with four equally likely sections, each representing a probability of 1/4.
Teachers can use such images to facilitate discussions on probability, permutations, and likelihood, allowing students to explore and compare theoretical predictions with practical results.
Clip art like this helps demystify probability concepts by presenting visual, engaging, and hands-on simulations that mirror real-world random events. These visual aids are invaluable in making abstract ideas accessible and memorable.
Teacher's Script: Observe the spinner's layout and think about the likelihood of the arrow stopping on red. What interesting patterns could emerge if you were to perform this spin multiple times? Let's tally the results and discuss how they relate to our expectations of a 1/4 probability for each color.
Here is an interactive version of this spinner:
For a complete collection of math clip art related to Probability and Statistics click on this link: Probability Models: Spinners Collection.
| Common Core Standards | CCSS.MATH.CONTENT.7.SP.C.7, CCSS.MATH.CONTENT.7.SP.C.7.A, CCSS.MATH.CONTENT.7.SP.C.7.B |
|---|---|
| Grade Range | 6 - 12 |
| Curriculum Nodes |
Algebra • Probability and Data Analysis • Probability |
| Copyright Year | 2014 |
| Keywords | probability, statistics, data analysis, math clip art, clip art, clipart |