Display Title
Math Clip Art: Spinner, 4 Sections--Result 2
Display Title
Math Clip Art: Spinner, 4 Sections--Result 2

Topic
Probability and Statistics
Description
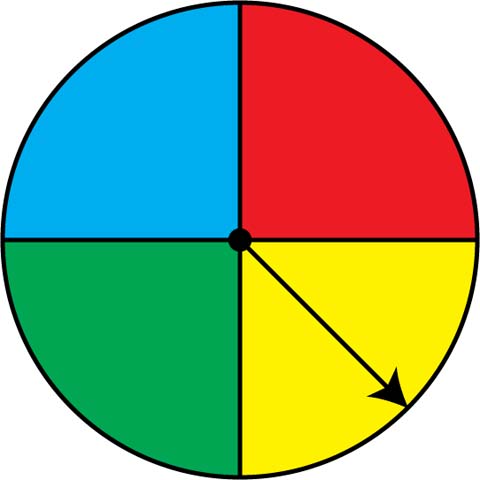
This image showcases a spinner divided into four equal segments: red, yellow, green, and blue. The spinner's arrow points to the yellow section, illustrating another possible outcome in this probability model.
As part of Probability and Statistics, this spinner visually represents an experimental probability scenario with four equally likely outcomes, each with a 1/4 probability of occurring.
Educators can utilize this image series to demonstrate concepts such as sample space, event probability, and the law of large numbers. Students can compare the results of multiple spins to the theoretical probability, gaining insights into experimental versus theoretical probability.
Using math clip art like this spinner helps bridge the gap between abstract probability concepts and tangible, visual representations. It offers students an interactive way to engage with probabilistic ideas, enhancing their understanding and retention of key concepts.
Teacher's Script: "Now we see the spinner landing on yellow. If we were to spin this many times, what distribution of results would you expect? Let's conduct an experiment and record our outcomes. How closely do our results align with the expected probability of 1/4 for each color?"
Here is an interactive version of this spinner:
For a complete collection of math clip art related to Probability and Statistics click on this link: Probability Models: Spinners Collection.
| Common Core Standards | CCSS.MATH.CONTENT.7.SP.C.7, CCSS.MATH.CONTENT.7.SP.C.7.A, CCSS.MATH.CONTENT.7.SP.C.7.B |
|---|---|
| Grade Range | 6 - 12 |
| Curriculum Nodes |
Algebra • Probability and Data Analysis • Probability |
| Copyright Year | 2014 |
| Keywords | probability, statistics, data analysis, math clip art, clip art, clipart |