Display Title
Math Clip Art: Spinner, 6 Sections--Result 5
Display Title
Math Clip Art: Spinner, 6 Sections--Result 5

Topic
Probability and Statistics
Description
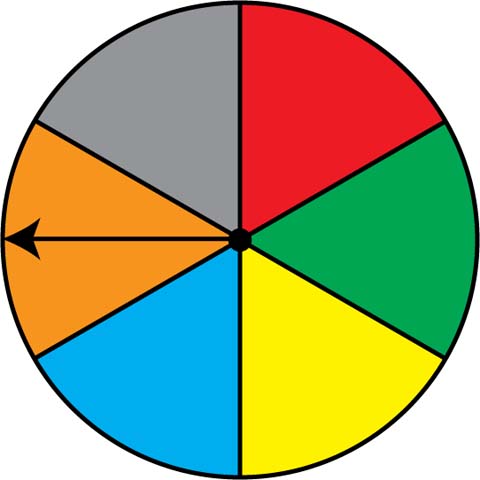
This image displays a spinner divided into six equal sections: yellow, blue, orange, grey, red, and green. The spinner's arrow currently points to the orange section, indicating one of the six possible outcomes.
In Probability and Statistics, this spinner serves as a vivid example of an experiment with multiple equally likely outcomes. Each section of the spinner represents a 1/6 probability, making it a useful tool for teaching the concept of equally probable events.
Teachers can use these spinner images to engage students in discussions about probability, the concept of randomness, and equiprobable events. By interacting with the spinner, students can better understand how probability works in a practical, visual context.
Math clip art like this provides a visual and interactive aid that helps students visualize and grasp the principles of probability, making abstract concepts more attainable and engaging.
Teacher's Script: When we spin the spinner, notice where it lands. Each color—yellow, blue, orange, grey, red, and green—has an equal chance of being selected. Let's predict the outcomes after multiple spins. Can you identify any patterns or trends? Discuss how this could be applied in real-world scenarios.
Here is an interactive version of this spinner:
For a complete collection of math clip art related to Probability and Statistics click on this link: Probability Models: Spinners Collection.
| Common Core Standards | CCSS.MATH.CONTENT.7.SP.C.7, CCSS.MATH.CONTENT.7.SP.C.7.A, CCSS.MATH.CONTENT.7.SP.C.7.B |
|---|---|
| Grade Range | 6 - 12 |
| Curriculum Nodes |
Algebra • Probability and Data Analysis • Probability |
| Copyright Year | 2014 |
| Keywords | probability, statistics, data analysis, math clip art, clip art, clipart |