Display Title
Math Clip Art: Spinner, 7 Sections--Result 1
Display Title
Math Clip Art: Spinner, 7 Sections--Result 1

Topic
Probability and Statistics
Description
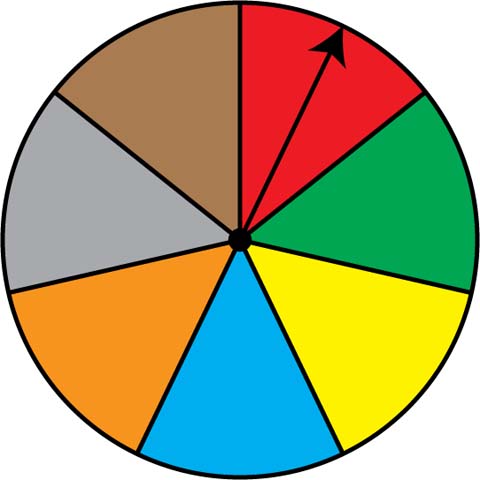
This image showcases a spinner divided into seven equal sections colored red, green, yellow, blue, orange, grey, and brown. The spinner's arrow points to the red section, illustrating one of the seven possible outcomes.
In the context of Probability and Statistics, this spinner represents a more complex probability model with seven equally likely outcomes. Each section has a probability of 1/7, demonstrating how probability changes as the number of possible outcomes increases.
Teachers can use this image series to explore concepts like sample space expansion, the law of large numbers, and how increasing the number of outcomes affects individual event probabilities. Students can compare this to simpler spinners, discussing how the likelihood of each outcome has changed.
Using such math clip art in teaching provides a visual and interactive way to explore advanced probability concepts. It allows students to see how theoretical probabilities translate into practical scenarios, enhancing their understanding of real-world applications of probability with multiple outcomes.
Teacher's Script: "Notice our spinner now has seven equal sections. How does this change the probability of landing on any one color? If we spin it 70 times, roughly how many times would we expect it to land on each color? Let's make predictions and then test them through a simulation!"
For a complete collection of math clip art related to Probability and Statistics click on this link: Probability Models: Spinners Collection.
| Common Core Standards | CCSS.MATH.CONTENT.7.SP.C.7, CCSS.MATH.CONTENT.7.SP.C.7.A, CCSS.MATH.CONTENT.7.SP.C.7.B |
|---|---|
| Grade Range | 6 - 12 |
| Curriculum Nodes |
Algebra • Probability and Data Analysis • Probability |
| Copyright Year | 2014 |
| Keywords | probability, statistics, data analysis, math clip art, clip art, clipart |