Display Title
Math Clip Art: Spinner, 7 Sections--Result 6
Display Title
Math Clip Art: Spinner, 7 Sections--Result 6

Topic
Probability and Statistics
Description
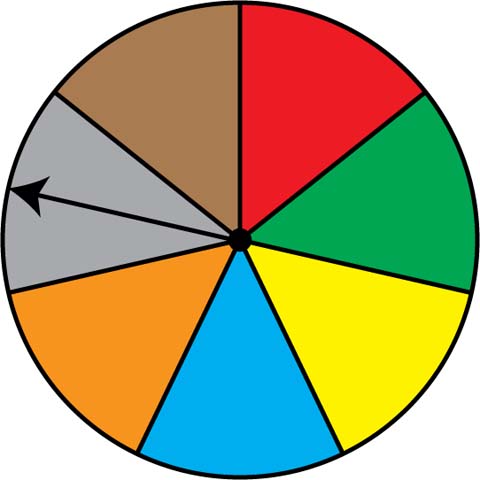
This image showcases a spinner divided into seven equal sections colored red, green, yellow, blue, orange, grey, and brown. The spinner's arrow points to the grey section, demonstrating the sixth possible outcome in this probability model.
In the context of Probability and Statistics, this spinner represents a more complex probability experiment with seven equally likely outcomes. It visually demonstrates the concepts of sample space and individual events within that space, each with a 1/7 probability of occurrence.
Teachers can use this image in conjunction with others to explain advanced concepts like experimental probability versus theoretical probability in multi-outcome scenarios. Students can conduct multiple spins, record results, and compare their findings to the expected equal distribution among the seven colors.
Utilizing such math clip art in teaching probability makes abstract concepts more tangible and relatable, especially when dealing with multiple outcomes. It offers students a concrete way to visualize and interact with probabilistic ideas, helping them to better understand and apply these concepts in various real-world scenarios with multiple variables.
Teacher's Script: "Now we see the spinner landing on grey. We've observed six out of seven possible outcomes. How close are our experimental results to the theoretical probability of 1/7 for each color? Let's discuss the importance of sample size in probability experiments. How might our results differ if we conducted 70 spins versus 700 spins? Can you think of any real-world applications where understanding probabilities with multiple outcomes is crucial?"
For a complete collection of math clip art related to Probability and Statistics click on this link: Probability Models: Spinners Collection.
| Common Core Standards | CCSS.MATH.CONTENT.7.SP.C.7, CCSS.MATH.CONTENT.7.SP.C.7.A, CCSS.MATH.CONTENT.7.SP.C.7.B |
|---|---|
| Grade Range | 6 - 12 |
| Curriculum Nodes |
Algebra • Probability and Data Analysis • Probability |
| Copyright Year | 2014 |
| Keywords | probability, statistics, data analysis, math clip art, clip art, clipart |