Display Title
Math Clip Art: Spinner, 9 Sections--Result 5
Display Title
Math Clip Art: Spinner, 9 Sections--Result 5

Topic
Probability and Statistics
Description
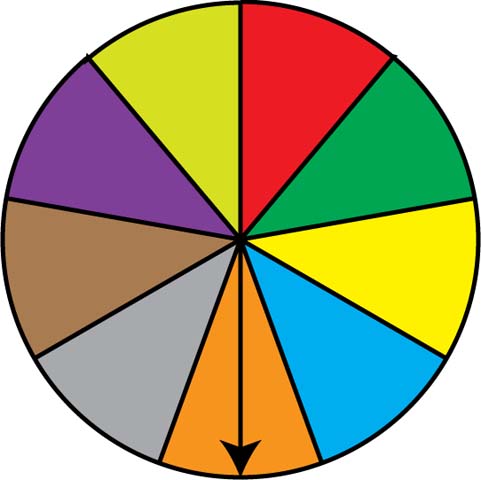
This image showcases a spinner divided into nine equal sections colored red, green, dark yellow, light blue, orange, grey, brown, purple, and light yellow. The spinner's arrow points to the orange section, illustrating another possible outcome in this probability model.
In the context of Probability and Statistics, this spinner represents a probability experiment with nine equally likely outcomes. It visually demonstrates the concepts of sample space and individual events within that space, each with a 1/9 probability of occurrence.
Educators can use this image series to demonstrate the concept of randomness and long-term behavior in probability with multiple outcomes. Students can compare the results of multiple spins to the theoretical probability, gaining insights into experimental versus theoretical probability.
Teacher's Script: "With the spinner landing on orange, we've now seen five different outcomes. How does this align with our expectations? If we were to conduct 900 spins, approximately how many times would we expect each color to appear? Let's discuss how increasing the number of trials affects the reliability of our experimental probability."
For a complete collection of math clip art related to Probability and Statistics, click on this link: Probability Models: Spinners Collection.
| Common Core Standards | CCSS.MATH.CONTENT.7.SP.C.7, CCSS.MATH.CONTENT.7.SP.C.7.A, CCSS.MATH.CONTENT.7.SP.C.7.B |
|---|---|
| Grade Range | 6 - 12 |
| Curriculum Nodes |
Algebra • Probability and Data Analysis • Probability |
| Copyright Year | 2014 |
| Keywords | probability, statistics, data analysis, math clip art, clip art, clipart |