Display Title
Math Clip Art: Spinner, 9 Sections--Result 6
Display Title
Math Clip Art: Spinner, 9 Sections--Result 6

Topic
Probability and Statistics
Description
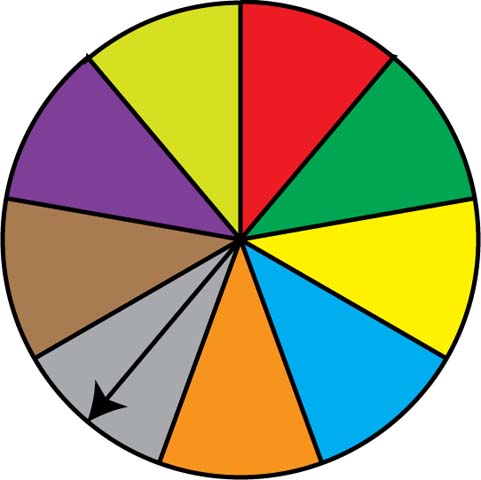
This image displays a spinner divided into nine equal sections colored red, green, dark yellow, light blue, orange, grey, brown, purple, and light yellow. The spinner's arrow points to the grey section, showcasing another possible outcome in this probability model.
In the field of Probability and Statistics, this spinner exemplifies a uniform probability distribution with nine equally likely outcomes. Each spin has a 1/9 probability of landing on any given color, illustrating the concept of equiprobable events in a more complex scenario.
Teachers can leverage this image series to explore topics such as expected value, variance, and the relationship between theoretical and experimental probability in multi-outcome scenarios. Students can conduct simulations, record data, and analyze the results to deepen their understanding of probabilistic concepts.
Teacher's Script: "Now we see the spinner landing on grey. We've observed six out of nine possible outcomes. How close are our experimental results to the theoretical probability of 1/9 for each color? Can you think of any real-world applications where understanding probabilities with multiple outcomes is crucial?"
For a complete collection of math clip art related to Probability and Statistics, click on this link: Probability Models: Spinners Collection.
| Common Core Standards | CCSS.MATH.CONTENT.7.SP.C.7, CCSS.MATH.CONTENT.7.SP.C.7.A, CCSS.MATH.CONTENT.7.SP.C.7.B |
|---|---|
| Grade Range | 6 - 12 |
| Curriculum Nodes |
Algebra • Probability and Data Analysis • Probability |
| Copyright Year | 2014 |
| Keywords | probability, statistics, data analysis, math clip art, clip art, clipart |