Display Title
Math Clip Art: Spinner, 9 Sections--Result 7
Display Title
Math Clip Art: Spinner, 9 Sections--Result 7

Topic
Probability and Statistics
Description
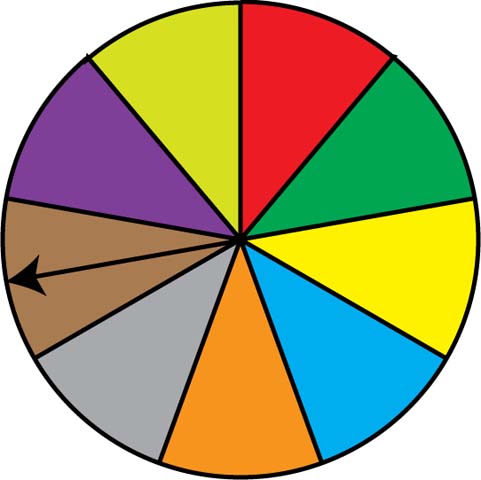
This image presents a spinner divided into nine equal sections colored red, green, dark yellow, light blue, orange, grey, brown, purple, and light yellow. The spinner's arrow points to the brown section, demonstrating another possible outcome in this probability model.
In Probability and Statistics, this spinner illustrates a fair probability experiment with nine mutually exclusive and equally likely outcomes. It provides a visual representation of how each spin has an equal 1/9 chance of landing on any of the nine colors.
Instructors can use this image series to demonstrate the concept of randomness, long-term behavior in probability, and the law of large numbers in multi-outcome scenarios. By comparing the results of multiple spins to the theoretical probability, students can grasp how experimental results converge to theoretical probabilities over many trials, even with increased variables.
Teacher's Script: "With the spinner landing on brown, we've now seen seven different outcomes. Let's reflect on the series of spins so far. How do these results compare to our initial expectations? Can you calculate the experimental probability for each color based on our trials? How might these results change if we increased the number of spins significantly?"
For a complete collection of math clip art related to Probability and Statistics, click on this link: Probability Models: Spinners Collection.
| Common Core Standards | CCSS.MATH.CONTENT.7.SP.C.7, CCSS.MATH.CONTENT.7.SP.C.7.A, CCSS.MATH.CONTENT.7.SP.C.7.B |
|---|---|
| Grade Range | 6 - 12 |
| Curriculum Nodes |
Algebra • Probability and Data Analysis • Probability |
| Copyright Year | 2014 |
| Keywords | probability, statistics, data analysis, math clip art, clip art, clipart |