Display Title
Math Example: Absolute Value Functions in Tabular and Graph Form: Example 11
Display Title
Absolute Value Functions in Tabular and Graph Form: Example 11

Topic
Special Functions
Description
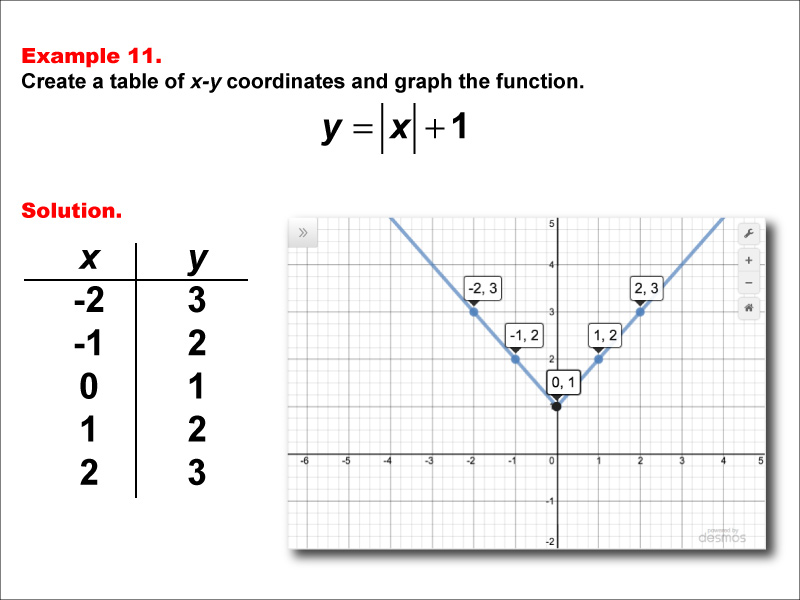
This math example demonstrates the creation of a table of x-y coordinates and the corresponding graph for the absolute value function y = |x| + 1. The image displays a V-shaped graph with points at (-2, 3), (-1, 2), (0, 1), (1, 2), and (2, 3). This example is part of a series exploring absolute value functions, illustrating how adding a constant to the function affects the graph's vertical position. Absolute value functions are a crucial concept in algebra, introducing students to equations that involve taking the absolute value of a variable or expression. This collection of examples showcases various forms of absolute value functions, allowing students to observe how changes in the equation impact the resulting graph's shape, position, and orientation. Providing multiple worked-out examples is essential for students to fully grasp the concept of absolute value functions. By examining different scenarios, students can identify patterns and develop a deeper understanding of how these functions behave. This approach helps reinforce important concepts such as the characteristic V-shape of absolute value graphs, the impact of constants outside the absolute value on the graph's vertical position, and how vertical and horizontal shifts affect the function's appearance. Through repeated exposure to diverse examples, students can build intuition and improve their ability to analyze and graph absolute value functions independently.
For a complete collection of math examples related to Special Functions: Absolute Value Functions click on this link: Math Examples: Special Functions: Absolute Value Functions Collection.
| Common Core Standards | CCSS.MATH.CONTENT.HSF.IF.C.7.B |
|---|---|
| Grade Range | 6 - 12 |
| Curriculum Nodes |
Algebra • Functions and Relations • Special Functions |
| Copyright Year | 2015 |
| Keywords | function, absolute value functions, graphs of absolute value functions, absolute value function tables |