Display Title
Math Example--Coordinate Geometry--Coordinate Systems: Example 14
Display Title
Math Example--Coordinate Geometry--Coordinate Systems: Example 14

Topic
Geometry
Description
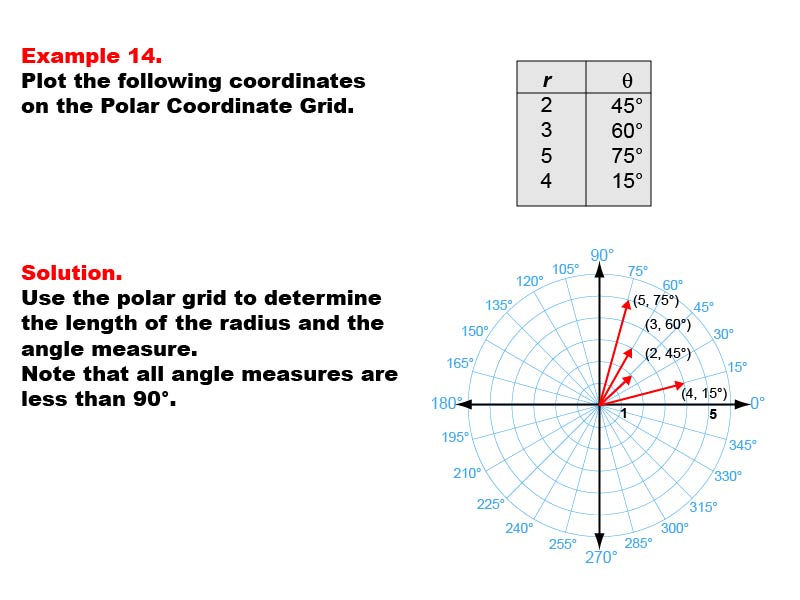
This example introduces plotting coordinates on a polar coordinate grid. The image shows four points plotted with their polar coordinates (r, θ): (2, 45°), (3, 60°), (5, 75°), and (4, 15°). Each point is labeled with its respective coordinates on the grid.
Understanding polar coordinates is crucial for many applications in mathematics and physics. This example helps students visualize how points are plotted using distance from the origin (r) and an angle (θ) instead of x and y coordinates.
By providing multiple examples of points on a polar grid, students can develop a clear understanding of how polar coordinates work and how they differ from Cartesian coordinates.
Teacher's Script: Take a close look at how these points are plotted. Notice how each point is determined by its distance from the center (r) and an angle (θ). Can you explain how this differs from plotting points on a Cartesian plane? Let's discuss how polar coordinates can be useful in certain situations and how they relate to Cartesian coordinates.
For a complete collection of math examples related to Coordinate Systems click on this link: Math Examples: Coordinate Systems Collection.
| Common Core Standards | CCSS.MATH.CONTENT.6.NS.C.8 |
|---|---|
| Grade Range | 6 - 8 |
| Curriculum Nodes |
Geometry • Coordinate Geometry • Coordinate Systems |
| Copyright Year | 2013 |
| Keywords | coordinate geometry, coordinate system, coordinate systems |