Display Title
Math Example--Exponential Concepts--Exponential Functions in Tabular and Graph Form: Example 20
Display Title
Math Example--Exponential Concepts--Exponential Functions in Tabular and Graph Form: Example 20

Topic
Exponential Functions
Description
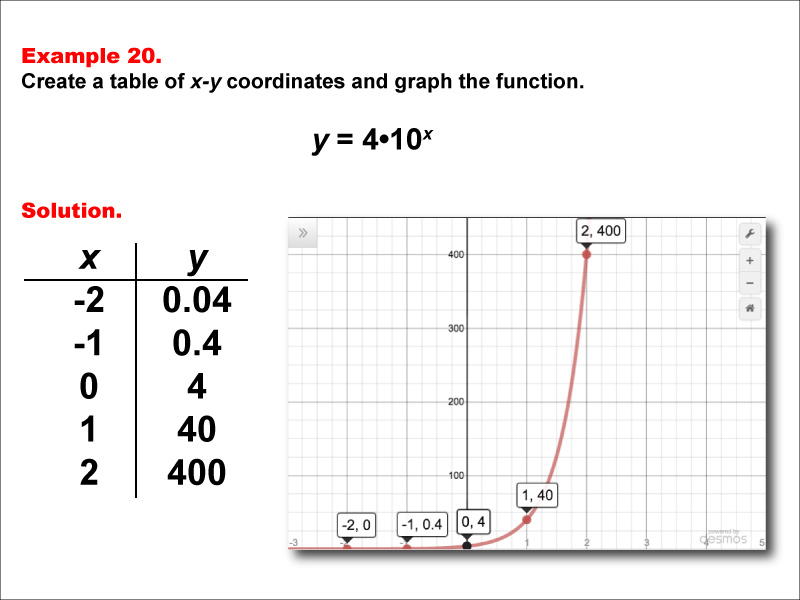
This example demonstrates the creation of a table of x-y coordinates and the graphing of the exponential function y = 4 * 10x. The image provides both a table of values and a graph plotted on a coordinate plane, with points labeled for x values ranging from -2 to 2. This representation helps students visualize the behavior of an increasing exponential function with a coefficient greater than 1 and a base of 10.
Exponential functions are a crucial concept in mathematics, with wide-ranging applications in fields such as economics, engineering, and natural sciences. This collection of examples aids in teaching the topic by offering students various representations of exponential functions. By examining different forms of these functions, students can develop a comprehensive understanding of how changes in the equation parameters affect the resulting graph and table of values.
The presentation of multiple worked-out examples is essential in mathematics education. Each example in this series provides a unique perspective on exponential functions, allowing students to identify patterns and make connections between different representations. This approach helps reinforce key concepts and fosters a deeper understanding of the subject matter, ultimately leading to improved problem-solving skills and mathematical reasoning abilities.
Teacher Script: "Let's analyze this example together. Notice how the coefficient 4 and the base of 10 affect the graph. Can you describe how the y-intercept has changed compared to the previous example? Observe how the y values increase even more rapidly as x increases. What do you think would happen if we changed the base from 10 to 5? How would this impact the steepness of the curve and the spacing between points? How does this graph compare to y = 4 * 2x that we saw earlier?"
For a complete collection of math examples related to Exponential Functions click on this link: Math Examples: Exponential Functions Collection.
| Common Core Standards | CCSS.MATH.CONTENT.HSF.IF.C.7.E, CCSS.Math.CONTENT.HSF.LE.A.2, CCSS.MATH.CONTENT.HSF.LE.B.5 |
|---|---|
| Grade Range | 9 - 12 |
| Curriculum Nodes |
Algebra • Exponential and Logarithmic Functions • Graphs of Exponential and Logarithmic Functions |
| Copyright Year | 2015 |
| Keywords | function, graphs of exponential functions, exponential function tables |