Display Title
Math Example--Exponential Concepts--Exponential Functions in Tabular and Graph Form: Example 25
Display Title
Math Example--Exponential Concepts--Exponential Functions in Tabular and Graph Form: Example 25

Topic
Exponential Functions
Description
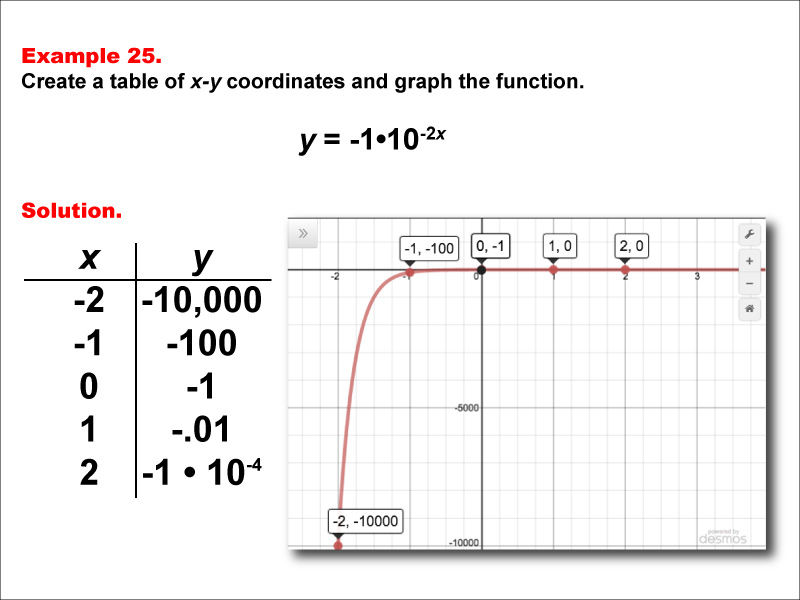
This math example focuses on creating a table of x-y coordinates and graphing the exponential function y = -1 * 10-2x. The image displays both a graph and a corresponding table, illustrating the behavior of this negative exponential function with a doubled exponent. The table includes key points such as (-2, -10000), (-1, -100), (0, -1), (1, -0.01), and (2, -1 * 10-4), demonstrating how rapidly the y-values approach zero from the negative side as x increases.
Exponential functions are a fundamental concept in mathematics, with applications in various fields such as physics, chemistry, and economics. This collection of examples helps teach the topic by providing visual and numerical representations of different types of exponential functions, including those with negative coefficients and negative exponents of varying magnitudes. Students can observe how these factors affect the graph's shape, the rate of change, and the overall behavior of the function, developing a more nuanced understanding of exponential relationships.
Offering multiple worked-out examples is crucial for students to fully grasp the concept of exponential functions. By examining diverse cases, students can identify patterns, compare and contrast different functions, and develop a deeper insight into how exponential functions behave in various scenarios. This approach helps reinforce key concepts and improves students' ability to analyze and interpret exponential relationships in different contexts, such as radioactive decay, sound intensity, or compound interest with continuous compounding.
Teacher Script: "Let's examine this interesting exponential function, y = -1 * 10-2x. How does it differ from our previous examples? Notice the doubled exponent -2x and how it affects the rate at which the y-values approach zero. Can you describe what happens to the y-values as x increases? This function demonstrates a very rapid exponential decay. How might we use this type of function to model real-world situations, such as the decay of a radioactive isotope with a very short half-life?"
For a complete collection of math examples related to Exponential Functions click on this link: Math Examples: Exponential Functions Collection.
| Common Core Standards | CCSS.MATH.CONTENT.HSF.IF.C.7.E, CCSS.Math.CONTENT.HSF.LE.A.2, CCSS.MATH.CONTENT.HSF.LE.B.5 |
|---|---|
| Grade Range | 9 - 12 |
| Curriculum Nodes |
Algebra • Exponential and Logarithmic Functions • Graphs of Exponential and Logarithmic Functions |
| Copyright Year | 2015 |
| Keywords | function, graphs of exponential functions, exponential function tables |