Display Title
Math Example--Exponential Concepts--Exponential Functions in Tabular and Graph Form: Example 26
Display Title
Math Example--Exponential Concepts--Exponential Functions in Tabular and Graph Form: Example 26

Topic
Exponential Functions
Description
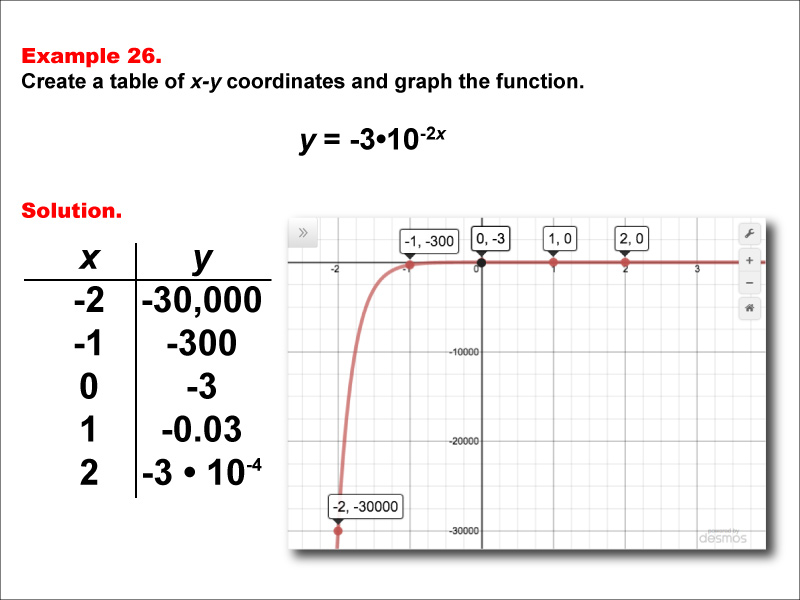
This math example demonstrates the creation of a table of x-y coordinates and the graphing of the exponential function y = -3 * 10-2x. The image showcases both a graph and a corresponding table, highlighting the behavior of this negative exponential function with a coefficient and a doubled exponent. The table includes key points such as (-2, -30000), (-1, -300), (0, -3), (1, -0.03), and (2, -3 * 10-4), illustrating how rapidly the y-values approach zero from the negative side as x increases.
Exponential functions are a vital concept in mathematics, with applications in various fields such as finance, biology, and engineering. This collection of examples aids in teaching the topic by providing visual and numerical representations of different exponential functions, including those with negative coefficients, negative exponents, and varying magnitudes. Students can observe how these factors affect the graph's shape, the y-intercept, the rate of change, and the overall behavior of the function, developing a more comprehensive understanding of exponential relationships.
Presenting multiple worked-out examples is essential for students to fully comprehend exponential functions. By examining diverse cases, students can identify patterns, compare different functions, and gain a deeper insight into the behavior of exponential relationships. This approach helps reinforce key concepts and enhances students' ability to analyze and interpret exponential functions in various real-world scenarios, such as population dynamics, chemical reactions, or financial modeling.
Teacher Script: "Now, let's look at this exponential function, y = -3 * 10-2x. How does it compare to our previous examples? Notice the coefficient -3 and the doubled exponent -2x. How do these affect the y-intercept and the rate at which the function approaches zero? Can you describe what happens to the y-values as x increases? This function demonstrates a very rapid exponential decay with a different starting point. How might we use this type of function to model real-world situations, such as the cooling of a hot object in a very cold environment?"
For a complete collection of math examples related to Exponential Functions click on this link: Math Examples: Exponential Functions Collection.
| Common Core Standards | CCSS.MATH.CONTENT.HSF.IF.C.7.E, CCSS.Math.CONTENT.HSF.LE.A.2, CCSS.MATH.CONTENT.HSF.LE.B.5 |
|---|---|
| Grade Range | 9 - 12 |
| Curriculum Nodes |
Algebra • Exponential and Logarithmic Functions • Graphs of Exponential and Logarithmic Functions |
| Copyright Year | 2015 |
| Keywords | function, graphs of exponential functions, exponential function tables |