Display Title
Math Example--Exponential Concepts--Exponential Functions in Tabular and Graph Form: Example 3
Display Title
Math Example--Exponential Concepts--Exponential Functions in Tabular and Graph Form: Example 3

Topic
Exponential Functions
Description
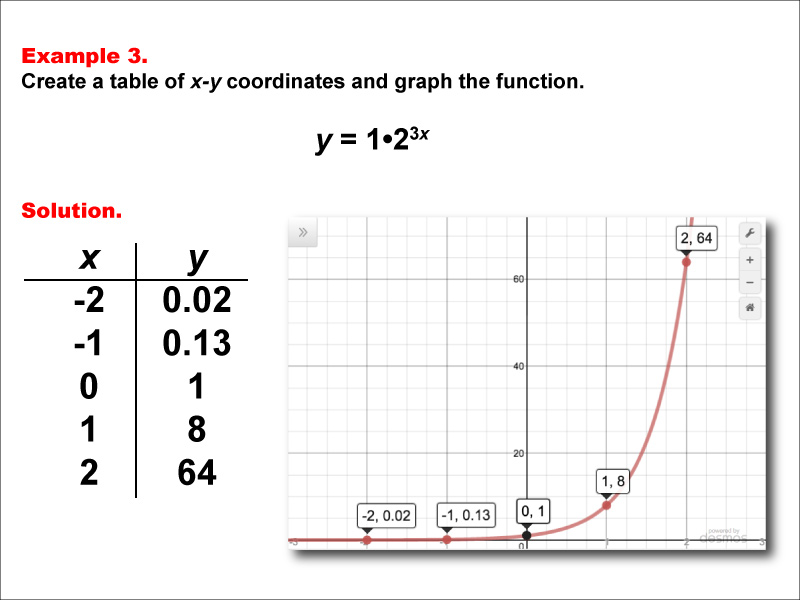
This example showcases the exponential function y = 1 * 23x through a table of x-y coordinates and its corresponding graph. The table presents five key points: (-2, 0.02), (-1, 0.13), (0, 1), (1, 8), and (2, 64). These points are then plotted on a graph, illustrating the rapid growth of this function as x increases.
Exponential functions play a vital role in modeling various phenomena in science, economics, and engineering. This collection of examples helps teach the topic by demonstrating different forms of exponential functions, allowing students to observe how changes in the exponent affect the function's rate of growth and the resulting graph shape.
Providing students with multiple worked-out examples is essential for developing a deep understanding of exponential functions. Each example builds upon previous knowledge, helping students recognize patterns and develop intuition about exponential growth rates. This approach enables learners to construct a robust mental model of exponential behavior, which they can apply to more complex scenarios in their future studies and real-world applications.
Teacher Script: "Let's analyze this function closely. Notice how much more rapidly this function grows compared to the previous examples. The exponent 3x causes the function to increase at a much faster rate. Can you explain why the y-value is less than 1 when x is negative? How does this relate to the concept of exponential decay? Understanding these relationships will help you grasp more complex exponential models in the future."
For a complete collection of math examples related to Exponential Functions click on this link: Math Examples: Exponential Functions Collection.
| Common Core Standards | CCSS.MATH.CONTENT.HSF.IF.C.7.E, CCSS.Math.CONTENT.HSF.LE.A.2, CCSS.MATH.CONTENT.HSF.LE.B.5 |
|---|---|
| Grade Range | 9 - 12 |
| Curriculum Nodes |
Algebra • Exponential and Logarithmic Functions • Graphs of Exponential and Logarithmic Functions |
| Copyright Year | 2015 |
| Keywords | function, graphs of exponential functions, exponential function tables |