Display Title
Math Example--Exponential Concepts--Exponential Functions in Tabular and Graph Form: Example 37
Display Title
Math Example--Exponential Concepts--Exponential Functions in Tabular and Graph Form: Example 37

Topic
Exponential Functions
Description
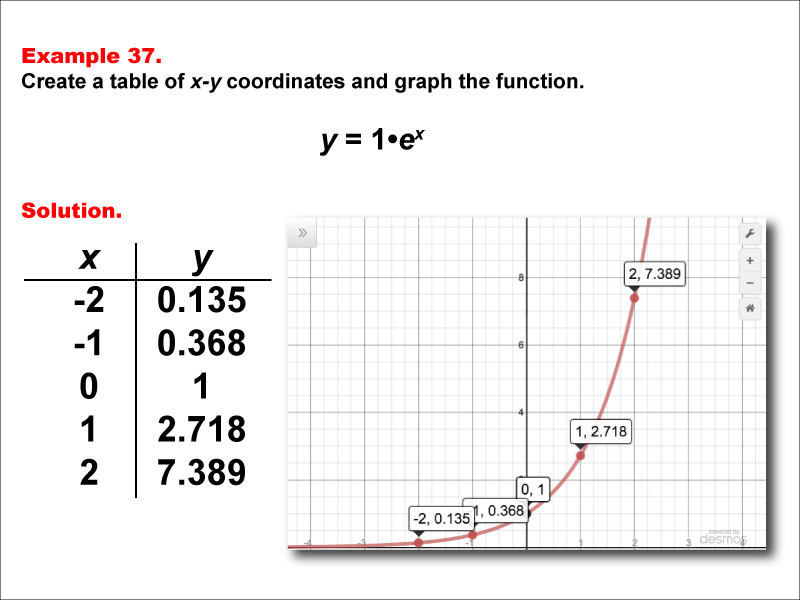
This math example presents the exponential function y = 1 * ex through both a table of x-y coordinates and a graph. The table provides values for x ranging from -2 to 2, demonstrating how the function's output changes as x increases. The accompanying graph offers a visual representation of this natural exponential function, highlighting its characteristic shape and behavior.
Exponential functions, particularly those using the natural base e, are crucial in mathematics and have wide-ranging applications in fields such as finance, physics, and biology. This collection of examples aids in teaching the topic by presenting students with various representations of exponential functions, allowing them to observe how different parameters affect the function's behavior. By examining both tabular and graphical forms of the natural exponential function, students can develop a deeper understanding of its unique properties and its role in modeling continuous growth or decay processes.
The importance of studying multiple worked-out examples cannot be overstated when learning about exponential functions, especially those involving e. Each example in this set highlights a different aspect of exponential functions, helping students recognize patterns and understand how changes in the base, coefficient, or exponent impact the function's graph and values. This variety of examples reinforces the concept and helps students build a more intuitive grasp of exponential behavior, preparing them to tackle more complex problems and real-world applications involving natural growth and decay.
Teacher Script: "Now, let's look at the function y = 1 * ex. This is the natural exponential function, which is fundamental in calculus and many scientific applications. Notice how the graph passes through the point (0, 1) and grows rapidly as x increases. Compare this to our previous examples with base 10. How does the growth rate differ? Can you think of any real-world phenomena that might be modeled by this function?"
For a complete collection of math examples related to Exponential Functions click on this link: Math Examples: Exponential Functions Collection.
| Common Core Standards | CCSS.MATH.CONTENT.HSF.IF.C.7.E, CCSS.Math.CONTENT.HSF.LE.A.2, CCSS.MATH.CONTENT.HSF.LE.B.5 |
|---|---|
| Grade Range | 9 - 12 |
| Curriculum Nodes |
Algebra • Exponential and Logarithmic Functions • Graphs of Exponential and Logarithmic Functions |
| Copyright Year | 2015 |
| Keywords | function, graphs of exponential functions, exponential function tables |