Display Title
Math Example--Exponential Concepts--Exponential Functions in Tabular and Graph Form: Example 48
Display Title
Math Example--Exponential Concepts--Exponential Functions in Tabular and Graph Form: Example 48

Topic
Exponential Functions
Description
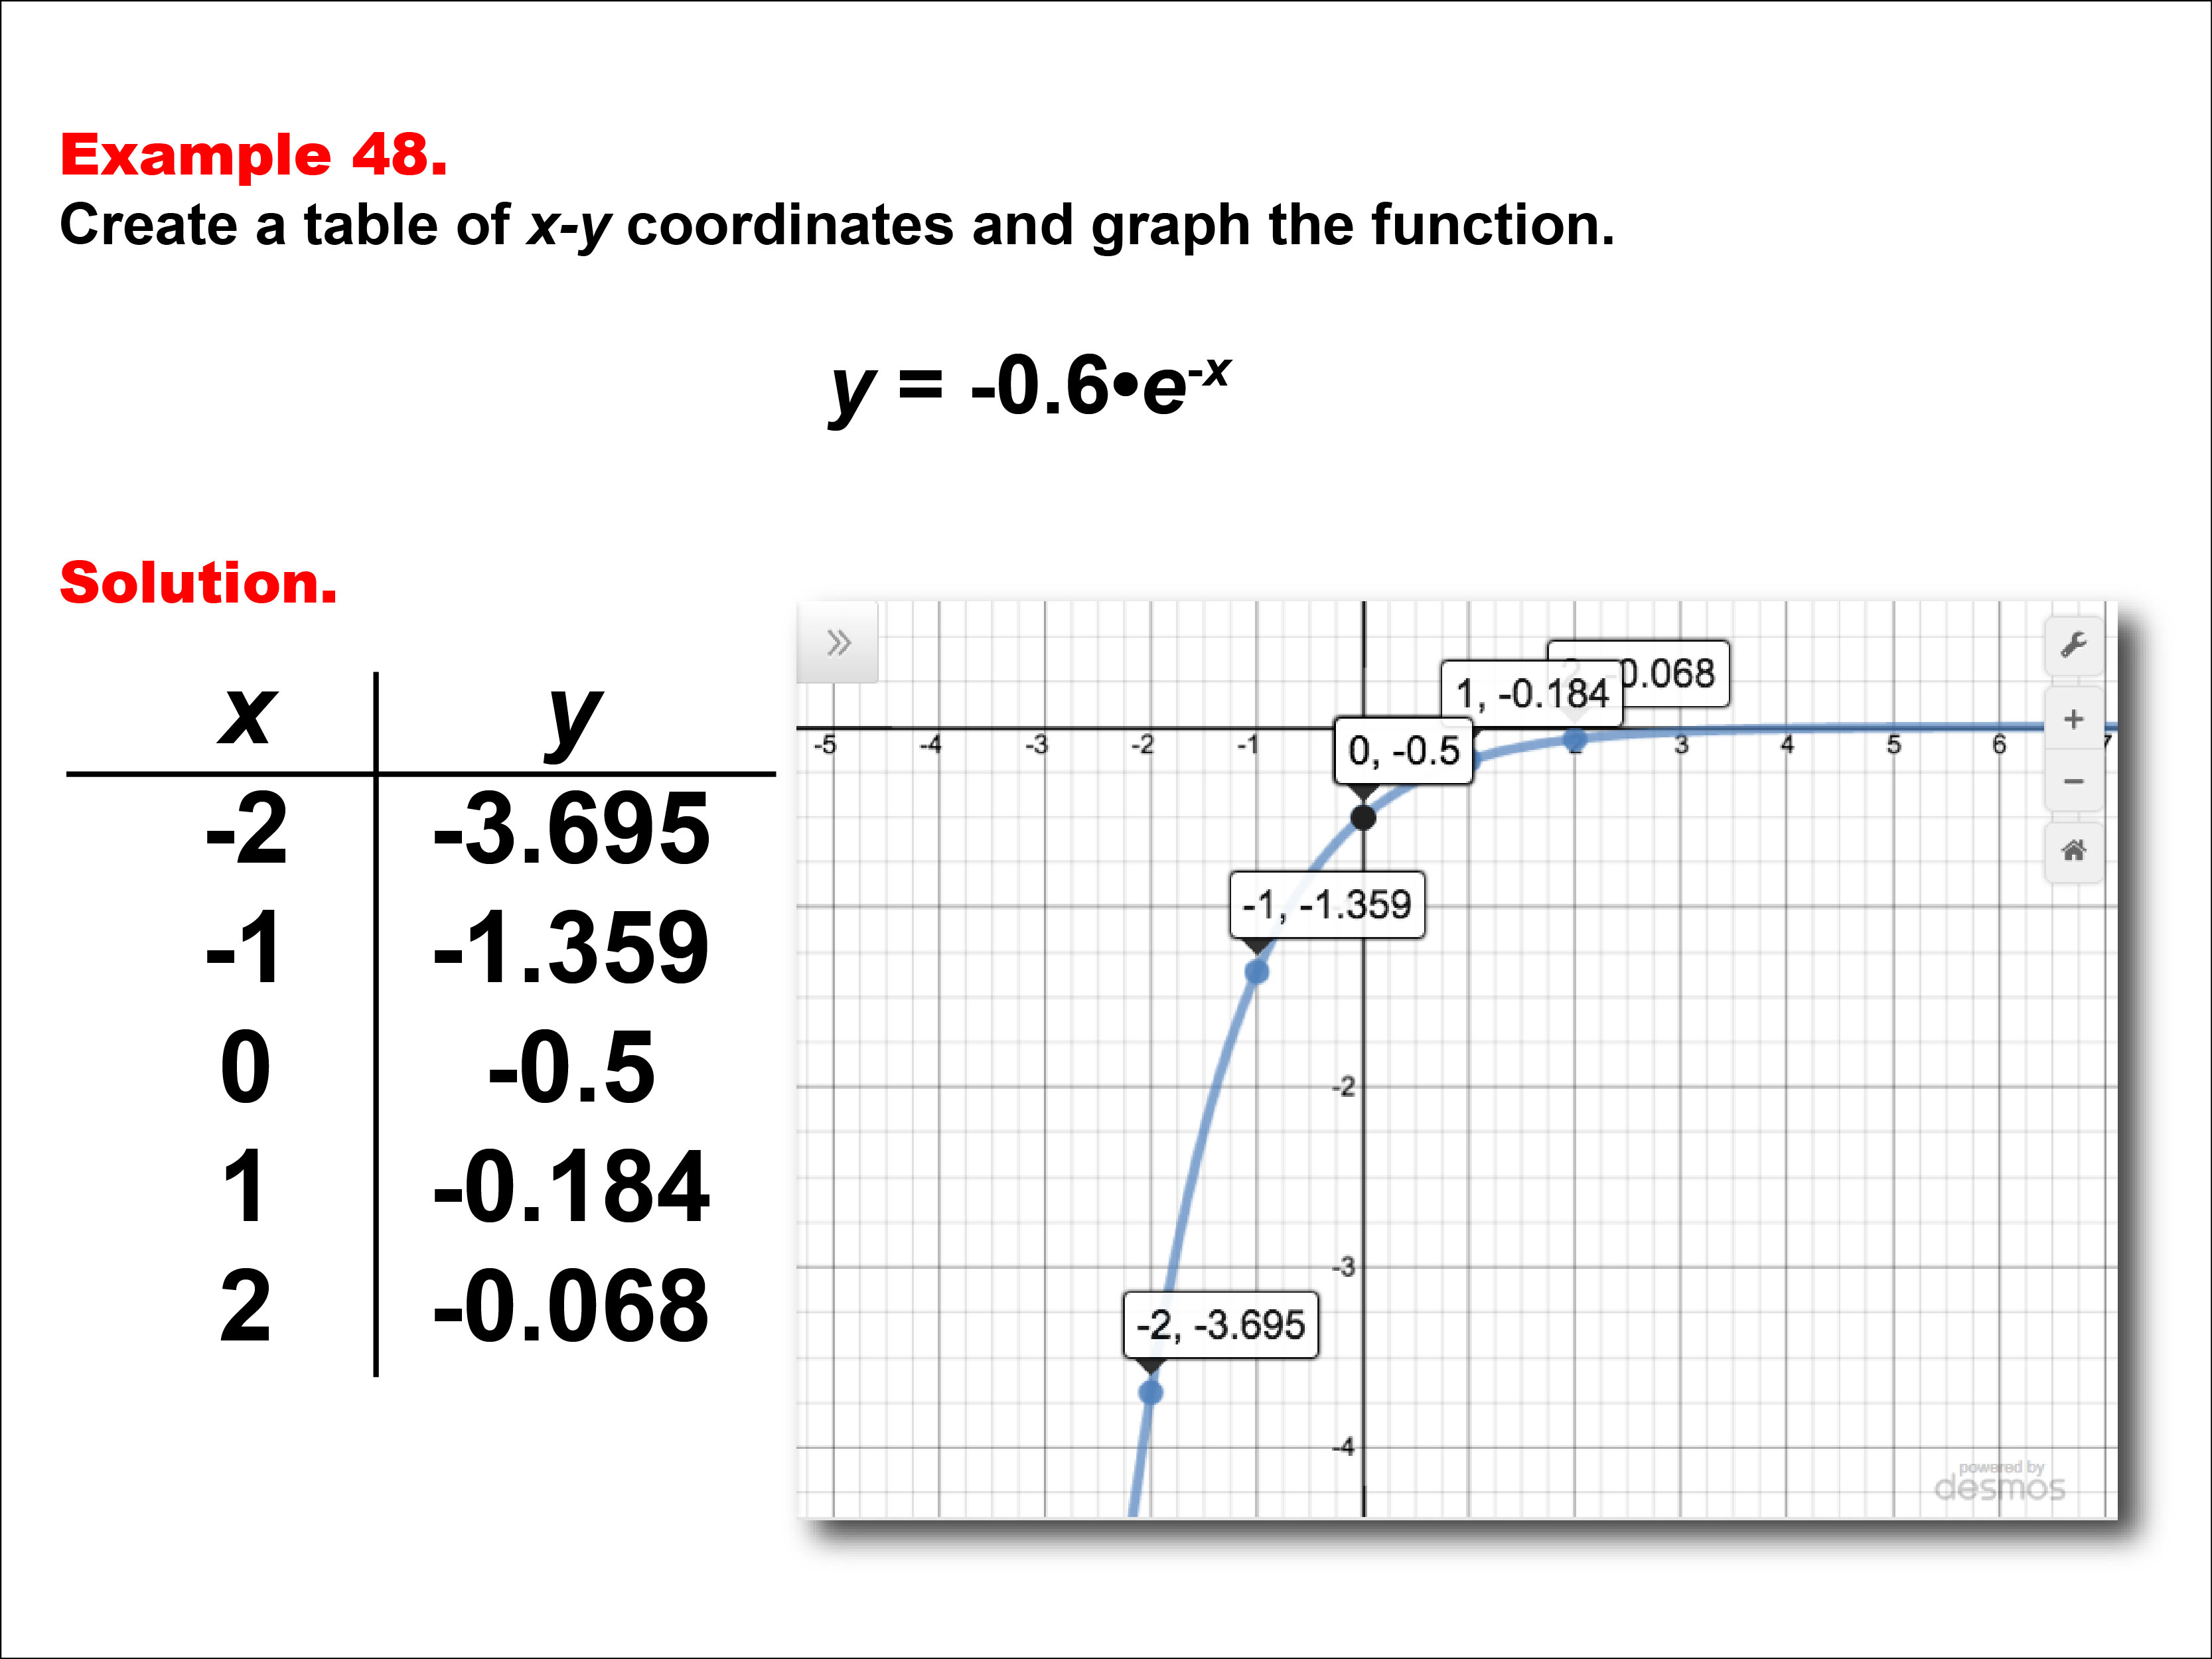
This example presents the exponential function y = -0.5 * e-x through a graph and table of x-y coordinates. The table provides points (-2, -3.695), (-1, -1.359), (0, -0.5), (1, -0.184), and (2, -0.068), which are plotted on the accompanying graph. Students are tasked with creating this table and graph to visualize the function's behavior.
Exponential functions with negative coefficients and negative exponents, such as this one, demonstrate decay processes with a reflection across the x-axis. This collection of examples highlights various forms of exponential functions, including those with different bases, coefficients, and exponents. By exploring these variations, students can better understand how changes in the equation affect the shape and behavior of the graph, reinforcing their grasp of exponential functions and their real-world applications.
Offering multiple worked-out examples is crucial for students to fully comprehend mathematical concepts like exponential functions. It allows them to observe patterns, make predictions, and build confidence in interpreting and creating graphs. Engaging with diverse problems helps develop a robust, long-lasting understanding of these important mathematical ideas, preparing students for more advanced topics and real-world problem-solving scenarios.
Teacher Script: As you examine this graph and table, consider how the negative coefficient and negative exponent influence the shape and direction of the curve. How does this function differ from exponential growth functions we've seen before? Discuss with your classmates any trends you notice in the y-values as x increases. Before plotting the points, what predictions can you make about the graph's appearance and its behavior as x approaches positive infinity?
For a complete collection of math examples related to Exponential Functions click on this link: Math Examples: Exponential Functions Collection.
| Common Core Standards | CCSS.MATH.CONTENT.HSF.IF.C.7.E, CCSS.Math.CONTENT.HSF.LE.A.2, CCSS.MATH.CONTENT.HSF.LE.B.5 |
|---|---|
| Grade Range | 9 - 12 |
| Curriculum Nodes |
Algebra • Exponential and Logarithmic Functions • Graphs of Exponential and Logarithmic Functions |
| Copyright Year | 2015 |
| Keywords | function, graphs of exponential functions, exponential function tables |