Display Title
Math Example--Exponential Concepts--Graphs of Exponential Functions: Example 1
Display Title
Math Example--Exponential Concepts--Graphs of Exponential Functions: Example 1

Topic
Exponential Functions
Description
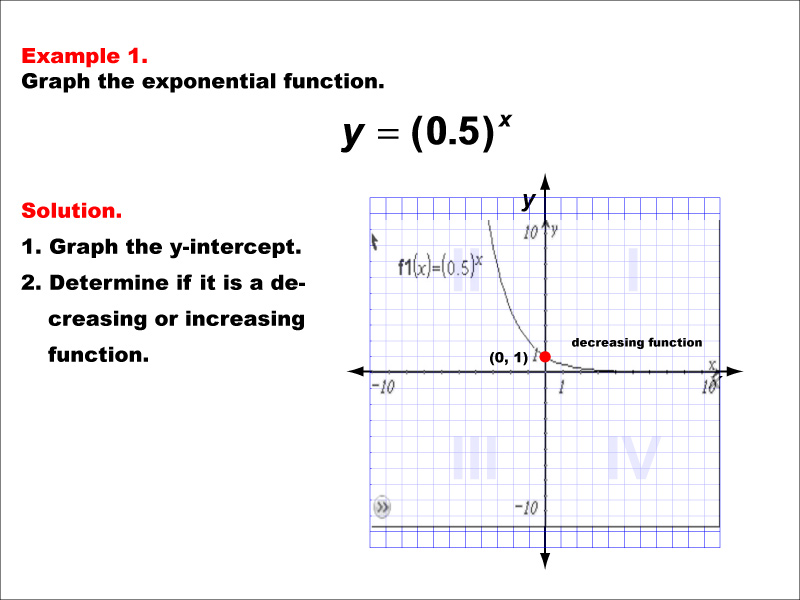
This example demonstrates the graph of the exponential function y = (0.5)x. The graph shows a decreasing curve with a y-intercept at ( 0 , 1 ). Students are asked to graph the y-intercept and determine if the function is decreasing or increasing.
Exponential functions are a crucial topic in mathematics, particularly in algebra and calculus. These functions model various real-world phenomena, such as population growth, radioactive decay, and compound interest. By examining multiple examples of exponential function graphs, students can develop a deeper understanding of their behavior and characteristics.
Providing students with multiple worked-out examples is essential for mastering the concept of exponential functions. Each example reinforces key ideas while introducing slight variations, allowing students to recognize patterns and build a comprehensive understanding of how different parameters affect the graph's shape and behavior.
Teacher Script: "Let's look at our first example of an exponential function graph. Notice how the curve starts at ( 0 , 1 ) and decreases as x increases. This is because our base, 0.5, is less than 1. Can you predict what would happen if we used a base greater than 1? In the following examples, we'll explore different bases and how they affect the graph's behavior."
For a complete collection of math examples related to Graphs of Exponential Functions click on this link: Math Examples: Graphs of Exponential Functions Collection.
| Common Core Standards | CCSS.MATH.CONTENT.HSF.IF.C.7, CCSS.MATH.CONTENT.HSF.IF.C.8.B, CCSS.MATH.CONTENT.HSF.BF.B.5, CCSS.MATH.CONTENT.HSF.IF.C.7.E, CCSS.Math.CONTENT.HSF.LE.A.2, CCSS.MATH.CONTENT.HSF.LE.A.3, CCSS.MATH.CONTENT.HSF.LE.A.4, CCSS.MATH.CONTENT.HSF.LE.B.5 |
|---|---|
| Grade Range | 9 - 12 |
| Curriculum Nodes |
Algebra • Exponential and Logarithmic Functions • Graphs of Exponential and Logarithmic Functions |
| Copyright Year | 2013 |
| Keywords | graphs |