Display Title
Math Example--Exponential Concepts--Graphs of Exponential Functions: Example 28
Display Title
Math Example--Exponential Concepts--Graphs of Exponential Functions: Example 28

Topic
Exponential Functions
Description
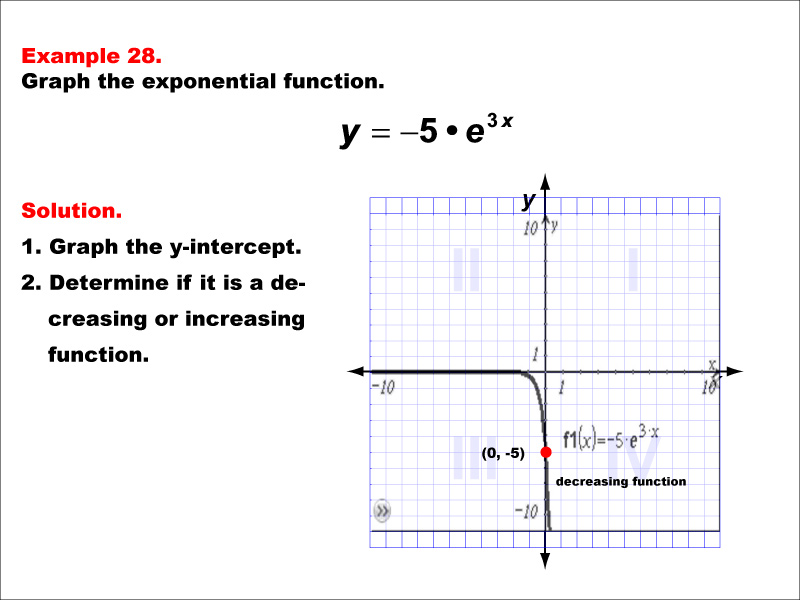
This example presents the graph of the exponential function y = -5 * e3x, where e is the mathematical constant approximately equal to 2.71828. The graph displays a rapidly decreasing curve with a y-intercept at ( 0 , -5 ). Students are asked to graph the y-intercept and determine whether the function is decreasing or increasing.
Exponential functions with base e are crucial in various mathematical and scientific applications. By examining this example with a negative coefficient multiplying the function and a positive coefficient in the exponent, students can develop a deeper understanding of how such modifications affect the behavior of natural exponential functions.
Providing students with multiple worked-out examples is essential for mastering the concept of exponential functions. Each example introduces a unique combination of coefficients and exponents, allowing students to observe how these elements interact to produce different graph characteristics. This approach helps students build intuition and analytical skills necessary for working with exponential functions in diverse contexts.
Teacher Script: "Let's examine our twenty-eighth example. We have the natural exponential function multiplied by -5, and 3x in the exponent. How do these changes affect the graph's behavior compared to our previous examples? Can you explain why the function decreases so rapidly? As we continue exploring more functions with base e, try to predict how the combination of a negative coefficient outside the exponential and a positive coefficient inside will influence the graph's steepness and direction."
For a complete collection of math examples related to Graphs of Exponential Functions click on this link: Math Examples: Graphs of Exponential Functions Collection.
| Common Core Standards | CCSS.MATH.CONTENT.HSF.IF.C.7, CCSS.MATH.CONTENT.HSF.IF.C.8.B, CCSS.MATH.CONTENT.HSF.BF.B.5, CCSS.MATH.CONTENT.HSF.IF.C.7.E, CCSS.Math.CONTENT.HSF.LE.A.2, CCSS.MATH.CONTENT.HSF.LE.A.3, CCSS.MATH.CONTENT.HSF.LE.A.4, CCSS.MATH.CONTENT.HSF.LE.B.5 |
|---|---|
| Grade Range | 9 - 12 |
| Curriculum Nodes |
Algebra • Exponential and Logarithmic Functions • Graphs of Exponential and Logarithmic Functions |
| Copyright Year | 2013 |
| Keywords | graphs |