Display Title
Math Example--Exponential Concepts--Graphs of Exponential Functions: Example 31
Display Title
Math Example--Exponential Concepts--Graphs of Exponential Functions: Example 31

Topic
Exponential Functions
Description
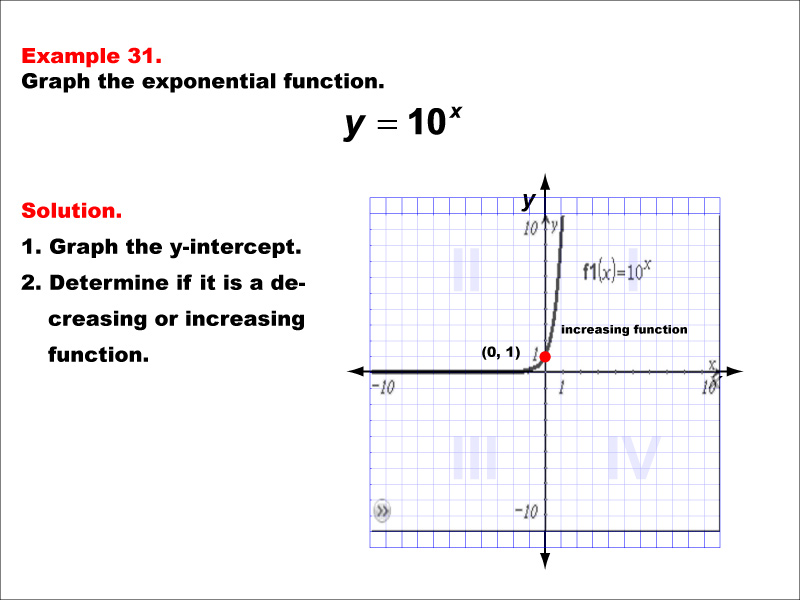
This example showcases the graph of the exponential function y = 10x. The graph displays an increasing curve with a y-intercept at ( 0 , 1 ). Students are tasked with graphing the y-intercept and determining if the function is decreasing or increasing.
Exponential functions with base 10 are particularly important in various scientific and engineering applications, especially when dealing with large scale changes or logarithmic scales. By examining this fundamental example, students can develop a deeper understanding of the behavior of exponential functions with base 10.
Providing students with this key example is essential for building a comprehensive understanding of exponential functions. The base-10 exponential function serves as a benchmark for comparing other exponential functions and is particularly important in scientific notation and logarithmic scales. This example helps students recognize the unique properties of 10 as a base and its significance in mathematical modeling.
Teacher Script: "Now, let's look at our thirty-first example. This is the exponential function with base 10, y = 10x. Notice how it passes through the point (0, 1). Can you explain why this function increases more rapidly than y = ex? As we explore more functions with base 10, try to consider how this fundamental example relates to other exponential functions we've seen and why it's so important in scientific and engineering applications."
For a complete collection of math examples related to Graphs of Exponential Functions click on this link: Math Examples: Graphs of Exponential Functions Collection.
| Common Core Standards | CCSS.MATH.CONTENT.HSF.IF.C.7, CCSS.MATH.CONTENT.HSF.IF.C.8.B, CCSS.MATH.CONTENT.HSF.BF.B.5, CCSS.MATH.CONTENT.HSF.IF.C.7.E, CCSS.Math.CONTENT.HSF.LE.A.2, CCSS.MATH.CONTENT.HSF.LE.A.3, CCSS.MATH.CONTENT.HSF.LE.A.4, CCSS.MATH.CONTENT.HSF.LE.B.5 |
|---|---|
| Grade Range | 9 - 12 |
| Curriculum Nodes |
Algebra • Exponential and Logarithmic Functions • Graphs of Exponential and Logarithmic Functions |
| Copyright Year | 2013 |
| Keywords | graphs |